Travelers 2008 Annual Report Download - page 89
Download and view the complete annual report
Please find page 89 of the 2008 Travelers annual report below. You can navigate through the pages in the report by either clicking on the pages listed below, or by using the keyword search tool below to find specific information within the annual report.-
 1
1 -
2
-
3
-
4
-
5
-
6
-
7
-
8
-
9
-
10
-
11
-
12
-
13
-
14
-
15
-
16
-
17
-
18
-
19
-
20
-
21
-
22
-
23
-
24
-
25
-
26
-
27
-
28
-
29
-
30
-
31
-
32
-
33
-
34
-
35
-
36
-
37
-
38
-
39
-
40
-
41
-
42
-
43
-
44
-
45
-
46
-
47
-
48
-
49
-
50
-
51
-
52
-
53
-
54
-
55
-
56
-
57
-
58
-
59
-
60
-
61
-
62
-
63
-
64
-
65
-
66
-
67
-
68
-
69
-
70
-
71
-
72
-
73
-
74
-
75
-
76
-
77
-
78
-
 79
79 -
 80
80 -
 81
81 -
 82
82 -
 83
83 -
 84
84 -
 85
85 -
 86
86 -
 87
87 -
 88
88 -
 89
89 -
 90
90 -
 91
91 -
 92
92 -
 93
93 -
 94
94 -
 95
95 -
 96
96 -
 97
97 -
 98
98 -
 99
99 -
100
-
101
-
102
-
103
-
104
-
105
-
106
-
107
-
108
-
109
-
110
-
111
-
112
-
113
-
114
-
115
-
116
-
117
-
118
-
119
-
120
-
121
-
122
-
123
-
124
-
125
-
126
-
127
-
128
-
129
-
130
-
131
-
132
-
133
-
134
-
135
-
136
-
137
-
138
-
139
-
140
-
141
-
142
-
143
-
144
-
145
-
146
-
147
-
148
-
149
-
150
-
151
-
152
-
153
-
154
-
155
-
156
-
157
-
158
-
159
-
160
-
161
-
162
-
163
-
164
-
165
-
166
-
167
-
168
-
169
-
170
-
171
-
172
-
173
-
174
-
175
-
176
-
177
-
178
-
179
-
180
-
181
-
182
-
183
-
184
-
185
-
186
-
187
-
188
-
189
-
190
-
191
-
192
-
193
-
194
-
195
-
196
-
197
-
198
-
199
-
200
-
201
-
202
-
203
-
204
-
205
-
206
-
207
-
208
-
209
-
210
-
211
-
212
-
213
-
214
-
215
-
216
-
217
-
218
-
219
-
220
-
221
-
222
-
223
-
224
-
225
-
226
-
227
-
228
-
229
-
230
-
231
-
232
-
233
-
234
-
235
-
236
-
237
-
238
-
239
-
240
-
241
-
242
-
243
-
244
-
245
-
246
-
247
-
248
-
249
-
250
-
251
-
252
-
253
-
254
-
255
-
256
-
257
-
258
-
259
-
260
-
261
-
262
-
263
-
264
-
265
-
266
-
267
-
268
-
269
-
270
-
271
-
272
-
273
-
274
-
275
-
276
-
277
-
278
-
279
-
280
-
281
-
282
-
283
-
284
-
285
-
286
-
287
-
288
 |
 |
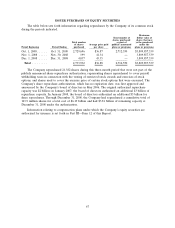
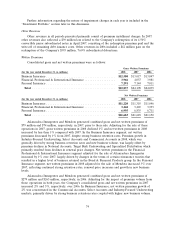
contingent commission program was not subject to deferred acquisition cost accounting treatment and,
therefore, was expensed as incurred. That timing difference resulted in a benefit to income during the
2007 transition year. The impact of this change in 2007 was to lower reported expenses by $376 million
in the ‘‘General and Administrative Expenses’’ income statement line, and increase reported expenses
by $213 million in the ‘‘Amortization of Deferred Acquisition Costs’’ income statement line, compared
to what would have been reported under the prior contingent commission program.
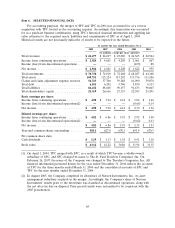
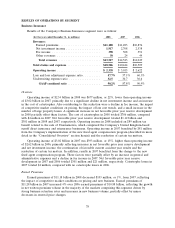
Interest Expense
Interest expense in 2008 totaled $370 million, an increase of $24 million, or 7%, over the 2007
total of $346 million. The increase primarily reflected a higher average level of debt outstanding at a
higher weighted average interest rate during 2008. Interest expense of $346 million in 2007 was
$22 million higher than the comparable 2006 total of $324 million. The increase primarily reflected the
impact of the Company’s issuance of debt in 2007, which is described in more detail in the ‘‘Liquidity
and Capital Resources’’ section herein. Proceeds from a substantial portion of debt issuances in 2007
were used to fund the redemption and maturity of certain of the Company’s indebtedness.
Effective Tax Rate
The Company’s effective tax rate was 21.3%, 26.0% and 26.5% in 2008, 2007 and 2006,
respectively. The declines in 2008 and 2007 primarily reflected a higher proportion of tax-exempt
investment income.
GAAP Combined Ratios
The consolidated loss and loss adjustment expense ratio of 59.4% for 2008 was 2.8 points higher
than the loss and loss adjustment expense ratio of 56.6% in 2007. The cost of catastrophes accounted
for 5.8 points of the 2008 loss and loss adjustment expense ratio, whereas the 2007 loss and loss
adjustment expense ratio included a 0.7 point impact from catastrophe losses. The 2008 and 2007 loss
and loss adjustment expense ratios included 7.1 point and 2.5 point benefits, respectively, from net
favorable prior year reserve development. The 2008 loss and loss adjustment expense ratio adjusted for
the cost of catastrophes and prior year reserve development was 2.3 points higher than the respective
2007 ratio on the same basis, reflecting the impact of competitive market conditions on pricing, a small
increase in the number of large losses, non-catastrophe weather related losses and loss cost trends.
The underwriting expense ratio of 32.5% in 2008 was 1.7 points higher than the 2007 underwriting
expense ratio of 30.8%. The 2008 expense ratio included a 0.7 point impact of the hurricane-related
assessments, whereas the 2007 ratio included a 0.8 point benefit from the implementation of the new
fixed agent compensation program described above. Adjusting for these factors in both years, the
adjusted 2008 expense ratio was 0.2 points higher than the adjusted expense ratio in 2007, reflecting
continued investments to support business growth and product development, as well as salary increases
in the normal course of business.
The consolidated loss and loss adjustment expense ratio of 56.6% in 2007 was 0.9 points lower
than the comparable 2006 loss and loss adjustment expense ratio of 57.5%. The 2007 and 2006 loss and
loss adjustment expense ratios included benefits of 2.5 points and 1.9 points, respectively, from net
favorable prior year reserve development. Catastrophe losses accounted for 0.7 points and 0.5 points of
the 2007 and 2006 loss and loss adjustment expense ratios. Excluding catastrophe losses and prior year
reserve development, the 2007 loss and loss adjustment expense ratio improved by 0.5 points compared
with the comparable 2006 ratio, reflecting continuing improvement in current accident year results in
several lines of business. The underwriting expense ratio of 30.8% in 2007 was 0.2 points higher than
the comparable 2006 underwriting expense ratio of 30.6%. The implementation of the new fixed agent
compensation program described above provided a benefit of 0.8 points to the expense ratios in 2007,
which was more than offset by the increases in expenses discussed above.
77