Travelers 2008 Annual Report Download - page 201
Download and view the complete annual report
Please find page 201 of the 2008 Travelers annual report below. You can navigate through the pages in the report by either clicking on the pages listed below, or by using the keyword search tool below to find specific information within the annual report.-
 1
1 -
2
-
3
-
4
-
5
-
6
-
7
-
8
-
9
-
10
-
11
-
12
-
13
-
14
-
15
-
16
-
17
-
18
-
19
-
20
-
21
-
22
-
23
-
24
-
25
-
26
-
27
-
28
-
29
-
30
-
31
-
32
-
33
-
34
-
35
-
36
-
37
-
38
-
39
-
40
-
41
-
42
-
43
-
44
-
45
-
46
-
47
-
48
-
49
-
50
-
51
-
52
-
53
-
54
-
55
-
56
-
57
-
58
-
59
-
60
-
61
-
62
-
63
-
64
-
65
-
66
-
67
-
68
-
69
-
70
-
71
-
72
-
73
-
74
-
75
-
76
-
77
-
78
-
79
-
80
-
81
-
82
-
83
-
84
-
85
-
86
-
87
-
88
-
89
-
90
-
91
-
92
-
93
-
94
-
95
-
96
-
97
-
98
-
99
-
100
-
101
-
102
-
103
-
104
-
105
-
106
-
107
-
108
-
109
-
110
-
111
-
112
-
113
-
114
-
115
-
116
-
117
-
118
-
119
-
120
-
121
-
122
-
123
-
124
-
125
-
126
-
127
-
128
-
129
-
130
-
131
-
132
-
133
-
134
-
135
-
136
-
137
-
138
-
139
-
140
-
141
-
142
-
143
-
144
-
145
-
146
-
147
-
148
-
149
-
150
-
151
-
152
-
153
-
154
-
155
-
156
-
157
-
158
-
159
-
160
-
161
-
162
-
163
-
164
-
165
-
166
-
167
-
168
-
169
-
170
-
171
-
172
-
173
-
174
-
175
-
176
-
177
-
178
-
179
-
180
-
181
-
182
-
183
-
184
-
185
-
186
-
187
-
188
-
189
-
190
-
 191
191 -
 192
192 -
 193
193 -
 194
194 -
 195
195 -
 196
196 -
 197
197 -
 198
198 -
 199
199 -
 200
200 -
 201
201 -
 202
202 -
 203
203 -
 204
204 -
 205
205 -
 206
206 -
 207
207 -
 208
208 -
 209
209 -
 210
210 -
 211
211 -
212
-
213
-
214
-
215
-
216
-
217
-
218
-
219
-
220
-
221
-
222
-
223
-
224
-
225
-
226
-
227
-
228
-
229
-
230
-
231
-
232
-
233
-
234
-
235
-
236
-
237
-
238
-
239
-
240
-
241
-
242
-
243
-
244
-
245
-
246
-
247
-
248
-
249
-
250
-
251
-
252
-
253
-
254
-
255
-
256
-
257
-
258
-
259
-
260
-
261
-
262
-
263
-
264
-
265
-
266
-
267
-
268
-
269
-
270
-
271
-
272
-
273
-
274
-
275
-
276
-
277
-
278
-
279
-
280
-
281
-
282
-
283
-
284
-
285
-
286
-
287
-
288
 |
 |

THE TRAVELERS COMPANIES, INC. AND SUBSIDIARIES
NOTES TO CONSOLIDATED FINANCIAL STATEMENTS (Continued)
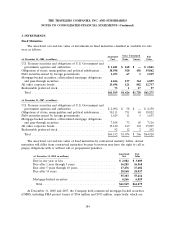
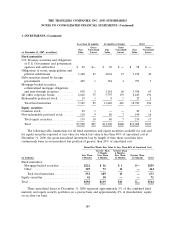
3. INVESTMENTS (Continued)
Less than 12 months 12 months or longer Total
Gross Gross Gross
Fair Unrealized Fair Unrealized Fair Unrealized
(at December 31, 2007, in millions) Value Losses Value Losses Value Losses
Fixed maturities
U.S. Treasury securities and obligations
of U.S. Government and government
agencies and authorities .......... $ 29 $— $ 69 $ — $ 98 $ —
Obligations of states, municipalities and
political subdivisions ............. 3,428 23 2,044 17 5,472 40
Debt securities issued by foreign
governments ................... 409 1 384 4 793 5
Mortgage-backed securities,
collateralized mortgage obligations
and pass-through securities ........ 838 5 3,118 60 3,956 65
All other corporate bonds ........... 2,646 55 5,797 139 8,443 194
Redeemable preferred stock ......... 19 1 8 1 27 2
Total fixed maturities ............ 7,369 85 11,420 221 18,789 306
Equity securities
Common stock ................... 29 1 — — 29 1
Non-redeemable preferred stock ...... 110 9 80 7 190 16
Total equity securities ............ 139 10 80 7 219 17
Total ........................ $7,508 $95 $11,500 $228 $19,008 $323
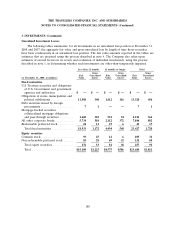
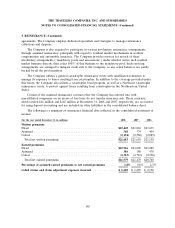
The following table summarizes for all fixed maturities and equity securities available for sale and
for equity securities reported at fair value for which fair value is less than 80% of amortized cost at
December 31, 2008, the gross unrealized investment loss by length of time those securities have
continuously been in an unrealized loss position of greater than 20% of amortized cost:
Period For Which Fair Value Is Less Than 80% of Amortized Cost
Greater Than Greater Than
3 Months, 6 Months,
Less Than Less Than Less Than Greater Than
(in millions) 3 Months 6 Months 12 Months 12 Months Total
Fixed maturities:
Mortgage-backed securities ........... $222 $ 36 $ 1 $— $259
Other .......................... 329 73 12 — 414
Total fixed maturities .............. 551 109 13 — 673
Equity securities .................... 41 30 — — 71
Total ............................. $592 $139 $13 $— $744
These unrealized losses at December 31, 2008 represent approximately 1% of the combined fixed
maturity and equity security portfolios on a pretax basis and approximately 2% of shareholders’ equity
on an after-tax basis.
189