Travelers 2008 Annual Report Download - page 141
Download and view the complete annual report
Please find page 141 of the 2008 Travelers annual report below. You can navigate through the pages in the report by either clicking on the pages listed below, or by using the keyword search tool below to find specific information within the annual report.-
 1
1 -
2
-
3
-
4
-
5
-
6
-
7
-
8
-
9
-
10
-
11
-
12
-
13
-
14
-
15
-
16
-
17
-
18
-
19
-
20
-
21
-
22
-
23
-
24
-
25
-
26
-
27
-
28
-
29
-
30
-
31
-
32
-
33
-
34
-
35
-
36
-
37
-
38
-
39
-
40
-
41
-
42
-
43
-
44
-
45
-
46
-
47
-
48
-
49
-
50
-
51
-
52
-
53
-
54
-
55
-
56
-
57
-
58
-
59
-
60
-
61
-
62
-
63
-
64
-
65
-
66
-
67
-
68
-
69
-
70
-
71
-
72
-
73
-
74
-
75
-
76
-
77
-
78
-
79
-
80
-
81
-
82
-
83
-
84
-
85
-
86
-
87
-
88
-
89
-
90
-
91
-
92
-
93
-
94
-
95
-
96
-
97
-
98
-
99
-
100
-
101
-
102
-
103
-
104
-
105
-
106
-
107
-
108
-
109
-
110
-
111
-
112
-
113
-
114
-
115
-
116
-
117
-
118
-
119
-
120
-
121
-
122
-
123
-
124
-
125
-
126
-
127
-
128
-
129
-
130
-
 131
131 -
 132
132 -
 133
133 -
 134
134 -
 135
135 -
 136
136 -
 137
137 -
 138
138 -
 139
139 -
 140
140 -
 141
141 -
 142
142 -
 143
143 -
 144
144 -
 145
145 -
 146
146 -
 147
147 -
 148
148 -
 149
149 -
 150
150 -
 151
151 -
152
-
153
-
154
-
155
-
156
-
157
-
158
-
159
-
160
-
161
-
162
-
163
-
164
-
165
-
166
-
167
-
168
-
169
-
170
-
171
-
172
-
173
-
174
-
175
-
176
-
177
-
178
-
179
-
180
-
181
-
182
-
183
-
184
-
185
-
186
-
187
-
188
-
189
-
190
-
191
-
192
-
193
-
194
-
195
-
196
-
197
-
198
-
199
-
200
-
201
-
202
-
203
-
204
-
205
-
206
-
207
-
208
-
209
-
210
-
211
-
212
-
213
-
214
-
215
-
216
-
217
-
218
-
219
-
220
-
221
-
222
-
223
-
224
-
225
-
226
-
227
-
228
-
229
-
230
-
231
-
232
-
233
-
234
-
235
-
236
-
237
-
238
-
239
-
240
-
241
-
242
-
243
-
244
-
245
-
246
-
247
-
248
-
249
-
250
-
251
-
252
-
253
-
254
-
255
-
256
-
257
-
258
-
259
-
260
-
261
-
262
-
263
-
264
-
265
-
266
-
267
-
268
-
269
-
270
-
271
-
272
-
273
-
274
-
275
-
276
-
277
-
278
-
279
-
280
-
281
-
282
-
283
-
284
-
285
-
286
-
287
-
288
 |
 |

multiplied by a projected loss ratio. The projected loss ratio is determined through an analysis of prior
periods’ experience, using loss trend, rate level differences, mix of business changes and other known or
observed factors influencing the current accident year relative to prior accident years. The exact
number of prior accident years utilized varies by product line component, based on the volume of
business for that component and the reliability of an individual accident year estimate.
Management’s estimates
At least once per quarter, certain Company management meets with its actuaries to review the
latest claims and claim adjustment expense reserve analyses. Based on these analyses, management
determines whether its ultimate claim liability estimates should be changed. In doing so, it must
evaluate whether the new data provided represents credible actionable information or an anomaly that
will have no effect on estimated ultimate claim liability. For example, as described above, payments
may have decreased in one geographic region due to fewer claim adjusters being available to process
claims. The resulting claim payment patterns would be analyzed to determine whether or not the
change in payment pattern represents a change in ultimate claim liability.
Such an assessment requires considerable judgment. It is frequently not possible to determine
whether a change in the data is an anomaly until sometime after the event. Even if a change is
determined to be permanent, it is not always possible to reliably determine the extent of the change
until sometime later. The overall detailed analyses supporting such an effort can take several months to
perform. This is because the underlying causes of the trends observed need to be evaluated, which may
require the gathering or assembling of data not previously available. It may also include interviews with
experts involved with the underlying processes. As a result, there can be a time lag between the
emergence of a change and a determination that the change should be reflected in the Company’s
estimated claim liabilities. The final estimate selected by management in a reporting period is based on
these various detailed analyses of past data, adjusted to reflect any new actionable information.
Discussion of Product Lines
The following section details reserving considerations and common risk factors by product line.
There are many additional risk factors that may impact ultimate claim costs. Each risk factor presented
will have a different impact on required reserves. Also, risk factors can have offsetting or compounding
effects on required reserves. For example, in workers’ compensation, the use of expensive medical
procedures that result in medical cost inflation may enable workers to return to work faster, thereby
lowering indemnity costs. Thus, in almost all cases, it is impossible to discretely measure the effect of a
single risk factor and construct a meaningful sensitivity expectation.
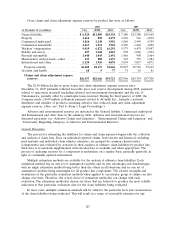
In order to provide information on reasonably possible reserving changes by product line, the
historical changes in year-end loss reserves over a one-year period are provided for the U.S. product
lines. This information is provided for both the Company and the industry for the nine most recent
years, and is based on the most recent publicly available data for the reported line(s) that most closely
match the individual product line being discussed. These changes were calculated, net of reinsurance,
from statutory annual statement data found in Schedule P of those statements, and represent the
reported reserve development on the beginning-of-the-year claim liabilities divided by the beginning
claim liabilities, all accident years combined, excluding non-defense related claim adjustment expense.
Data presented for the Company includes history for the entire Travelers group (U.S. companies only),
whether or not the individual subsidiaries were originally part of SPC or TPC. This treatment is
required by the statutory reporting instructions promulgated by state regulatory authorities for
Schedule P. Comparable data for non-U.S. companies is not available.
129