Travelers 2008 Annual Report Download - page 88
Download and view the complete annual report
Please find page 88 of the 2008 Travelers annual report below. You can navigate through the pages in the report by either clicking on the pages listed below, or by using the keyword search tool below to find specific information within the annual report.-
 1
1 -
2
-
3
-
4
-
5
-
6
-
7
-
8
-
9
-
10
-
11
-
12
-
13
-
14
-
15
-
16
-
17
-
18
-
19
-
20
-
21
-
22
-
23
-
24
-
25
-
26
-
27
-
28
-
29
-
30
-
31
-
32
-
33
-
34
-
35
-
36
-
37
-
38
-
39
-
40
-
41
-
42
-
43
-
44
-
45
-
46
-
47
-
48
-
49
-
50
-
51
-
52
-
53
-
54
-
55
-
56
-
57
-
58
-
59
-
60
-
61
-
62
-
63
-
64
-
65
-
66
-
67
-
68
-
69
-
70
-
71
-
72
-
73
-
74
-
75
-
76
-
77
-
 78
78 -
 79
79 -
 80
80 -
 81
81 -
 82
82 -
 83
83 -
 84
84 -
 85
85 -
 86
86 -
 87
87 -
 88
88 -
 89
89 -
 90
90 -
 91
91 -
 92
92 -
 93
93 -
 94
94 -
 95
95 -
 96
96 -
 97
97 -
 98
98 -
99
-
100
-
101
-
102
-
103
-
104
-
105
-
106
-
107
-
108
-
109
-
110
-
111
-
112
-
113
-
114
-
115
-
116
-
117
-
118
-
119
-
120
-
121
-
122
-
123
-
124
-
125
-
126
-
127
-
128
-
129
-
130
-
131
-
132
-
133
-
134
-
135
-
136
-
137
-
138
-
139
-
140
-
141
-
142
-
143
-
144
-
145
-
146
-
147
-
148
-
149
-
150
-
151
-
152
-
153
-
154
-
155
-
156
-
157
-
158
-
159
-
160
-
161
-
162
-
163
-
164
-
165
-
166
-
167
-
168
-
169
-
170
-
171
-
172
-
173
-
174
-
175
-
176
-
177
-
178
-
179
-
180
-
181
-
182
-
183
-
184
-
185
-
186
-
187
-
188
-
189
-
190
-
191
-
192
-
193
-
194
-
195
-
196
-
197
-
198
-
199
-
200
-
201
-
202
-
203
-
204
-
205
-
206
-
207
-
208
-
209
-
210
-
211
-
212
-
213
-
214
-
215
-
216
-
217
-
218
-
219
-
220
-
221
-
222
-
223
-
224
-
225
-
226
-
227
-
228
-
229
-
230
-
231
-
232
-
233
-
234
-
235
-
236
-
237
-
238
-
239
-
240
-
241
-
242
-
243
-
244
-
245
-
246
-
247
-
248
-
249
-
250
-
251
-
252
-
253
-
254
-
255
-
256
-
257
-
258
-
259
-
260
-
261
-
262
-
263
-
264
-
265
-
266
-
267
-
268
-
269
-
270
-
271
-
272
-
273
-
274
-
275
-
276
-
277
-
278
-
279
-
280
-
281
-
282
-
283
-
284
-
285
-
286
-
287
-
288
 |
 |
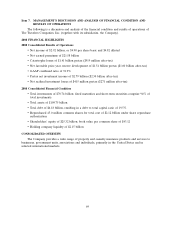
Factors contributing to net favorable prior year reserve development in each segment in 2008, 2007
and 2006 are discussed in more detail in the segment discussions that follow.
Claims and claim adjustment expenses of $12.40 billion in 2007 were $153 million, or 1%, higher
than the 2006 total of $12.24 billion. The 2007 total included $546 million of net favorable prior year
reserve development and $167 million of catastrophe losses, whereas the 2006 total included
$394 million of net favorable prior year reserve development and $103 million of catastrophe losses.
Net favorable prior year reserve development in 2006 was concentrated in the Personal Insurance
segment, primarily reflecting better than expected loss experience in the auto bodily injury and
non-catastrophe related Homeowners and Other lines of business, and a reduction in loss estimates for
the 2005 hurricanes. The Business Insurance segment also experienced net favorable prior year loss
experience in its ongoing operations in 2006, primarily in the commercial multi-peril, general liability,
property and commercial automobile lines of business. The favorable development in 2006 was partially
offset by $155 million and $120 million increases to asbestos and environmental reserves, respectively,
which are discussed in more detail in the ‘‘Asbestos Claims and Litigation’’ and ‘‘Environmental Claims
and Litigation’’ sections herein. There was also unfavorable prior year reserve development in runoff
assumed reinsurance business in 2006.
In 2006, catastrophe losses totaled $103 million, all of which was incurred in the Personal
Insurance segment and resulted from several wind, rain, hail and snow storms in the United States
throughout the year.
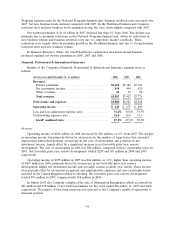
Amortization of Deferred Acquisition Costs
The amortization of deferred acquisition costs totaled $3.88 billion in 2008, $174 million, or 5%,
higher than the comparable 2007 total of $3.71 billion. The growth in amortization costs in 2008
primarily reflected the higher level of amortized commission expense resulting from the Company’s
implementation of a new fixed agent compensation program in 2007, described in more detail below.
The amortization of deferred acquisition costs totaled $3.71 billion in 2007, $367 million, or 11%,
higher than the comparable total of $3.34 billion in 2006, primarily reflecting a $213 million increase
from the implementation of a new fixed agent compensation program for the majority of the
Company’s agents described below. The remaining increase was primarily due to growth in business
volume in 2007.
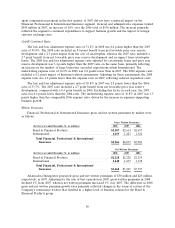
General and Administrative Expenses
General and administrative expenses totaled $3.52 billion in 2008, an increase of $166 million, or
5%, over the comparable 2007 total of $3.35 billion. This increase primarily reflected the impact of
$141 million of hurricane-related assessments.
General and administrative expenses totaled $3.35 billion in 2007, a decrease of $106 million, or
3%, from the comparable 2006 total of $3.46 billion. The decline primarily reflected the impact of the
Company’s implementation of the new fixed agent compensation program described in the following
paragraph, which was largely offset by expenses related to increased business volume and continued
expenditures to support business growth and product development.
In the first quarter of 2007, the Company discontinued the use of contingent commissions and
implemented a new fixed agent compensation program for all of its personal insurance business. The
Company also offered the majority of its agents conducting commercial insurance business the option
to switch to this new program. The Company’s total payout rate for all agent compensation for 2007
was substantially the same as for 2006; however, the change to the new program created a difference in
the timing of commission expense recognition. The cost of the new program is required to be deferred
and amortized over the related policy period (generally six to twelve months), whereas the cost of the
76