Travelers 2008 Annual Report Download - page 97
Download and view the complete annual report
Please find page 97 of the 2008 Travelers annual report below. You can navigate through the pages in the report by either clicking on the pages listed below, or by using the keyword search tool below to find specific information within the annual report.-
 1
1 -
2
-
3
-
4
-
5
-
6
-
7
-
8
-
9
-
10
-
11
-
12
-
13
-
14
-
15
-
16
-
17
-
18
-
19
-
20
-
21
-
22
-
23
-
24
-
25
-
26
-
27
-
28
-
29
-
30
-
31
-
32
-
33
-
34
-
35
-
36
-
37
-
38
-
39
-
40
-
41
-
42
-
43
-
44
-
45
-
46
-
47
-
48
-
49
-
50
-
51
-
52
-
53
-
54
-
55
-
56
-
57
-
58
-
59
-
60
-
61
-
62
-
63
-
64
-
65
-
66
-
67
-
68
-
69
-
70
-
71
-
72
-
73
-
74
-
75
-
76
-
77
-
78
-
79
-
80
-
81
-
82
-
83
-
84
-
85
-
86
-
 87
87 -
 88
88 -
 89
89 -
 90
90 -
 91
91 -
 92
92 -
 93
93 -
 94
94 -
 95
95 -
 96
96 -
 97
97 -
 98
98 -
 99
99 -
 100
100 -
 101
101 -
 102
102 -
 103
103 -
 104
104 -
 105
105 -
 106
106 -
 107
107 -
108
-
109
-
110
-
111
-
112
-
113
-
114
-
115
-
116
-
117
-
118
-
119
-
120
-
121
-
122
-
123
-
124
-
125
-
126
-
127
-
128
-
129
-
130
-
131
-
132
-
133
-
134
-
135
-
136
-
137
-
138
-
139
-
140
-
141
-
142
-
143
-
144
-
145
-
146
-
147
-
148
-
149
-
150
-
151
-
152
-
153
-
154
-
155
-
156
-
157
-
158
-
159
-
160
-
161
-
162
-
163
-
164
-
165
-
166
-
167
-
168
-
169
-
170
-
171
-
172
-
173
-
174
-
175
-
176
-
177
-
178
-
179
-
180
-
181
-
182
-
183
-
184
-
185
-
186
-
187
-
188
-
189
-
190
-
191
-
192
-
193
-
194
-
195
-
196
-
197
-
198
-
199
-
200
-
201
-
202
-
203
-
204
-
205
-
206
-
207
-
208
-
209
-
210
-
211
-
212
-
213
-
214
-
215
-
216
-
217
-
218
-
219
-
220
-
221
-
222
-
223
-
224
-
225
-
226
-
227
-
228
-
229
-
230
-
231
-
232
-
233
-
234
-
235
-
236
-
237
-
238
-
239
-
240
-
241
-
242
-
243
-
244
-
245
-
246
-
247
-
248
-
249
-
250
-
251
-
252
-
253
-
254
-
255
-
256
-
257
-
258
-
259
-
260
-
261
-
262
-
263
-
264
-
265
-
266
-
267
-
268
-
269
-
270
-
271
-
272
-
273
-
274
-
275
-
276
-
277
-
278
-
279
-
280
-
281
-
282
-
283
-
284
-
285
-
286
-
287
-
288
 |
 |
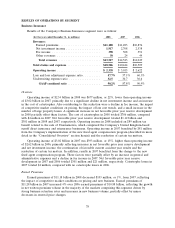
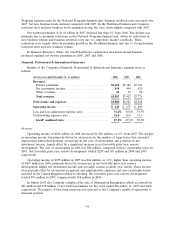
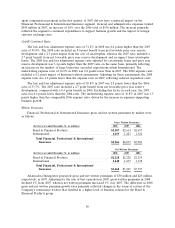
Earned Premiums
Earned premiums of $3.43 billion in 2008 increased $45 million, or 1%, over the 2007 total of
$3.38 billion. Adjusting for the sale of Afianzadora Insurgentes in 2007, earned premium growth of 2%
in 2008 was concentrated in the Construction Services business unit of the Bond & Financial Products
group due to changes in the terms of certain reinsurance treaties that resulted in a higher level of
business retained in the first quarter of the year.
Earned premiums in 2007 were slightly higher than in 2006. Adjusting for the sale of Afianzadora
Insurgentes in both years, earned premiums in 2007 grew 3% over 2006. Earned premium growth was
concentrated in the International group, driven by the favorable impact of foreign currency rates of
exchange and growth in business volume over the preceding twelve months. Earned premium growth in
2007 also benefited from adjustments to prior year premium estimates for the Company’s operations at
Lloyd’s.
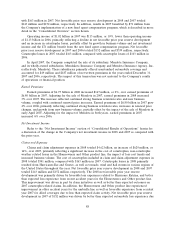
Net Investment Income
Refer to the ‘‘Net Investment Income’’ section of ‘‘Consolidated Results of Operations’’ herein for
a discussion of the change in the Company’s net investment income in 2008 and 2007 as compared with
the prior year, as well as a discussion of the Company’s net investment income allocation methodology.
Claims and Expenses
Claims and claim adjustment expenses of $1.77 billion in 2008 increased by $32 million, or 2%,
over 2007. An increase in the cost of catastrophes and an increase in the number of large losses that
exceeded expectations within International in 2008 were largely offset by a significant increase in net
favorable prior year reserve development. The cost of catastrophes included in claims and claim
adjustment expenses in 2008 totaled $73 million, compared with no catastrophe losses in 2007.
Hurricanes Ike and Gustav accounted for the majority of catastrophe losses in 2008.
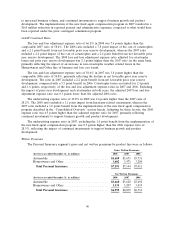
Net favorable prior year reserve development totaled $274 million in 2008, primarily driven by
better than expected loss experience in the International group. The improvements in longer-tail lines
of business were attributable to several factors, including enhanced risk control and underwriting
strategies throughout the International group. In the property line of business, the improvement
primarily resulted from better than anticipated loss development in the United Kingdom, in part due to
favorable claim activity relating to 2007 flood losses. In the Bond & Financial Products group, better
than expected loss experience for the contract surety business within the fidelity and surety product
line, resulting from favorable settlements on large claims (primarily from accident years prior to 2005),
resulted in net favorable prior year reserve development in 2008. In 2007, net favorable prior year
reserve development totaled $93 million, primarily reflecting better than expected loss development in
international property, employers’ liability, professional indemnity and motor lines of business for
recent accident years, which was attributable to several factors, including enhanced pricing and
underwriting strategies throughout the International operations, and the favorable impact of legal and
judicial reforms in Ireland.
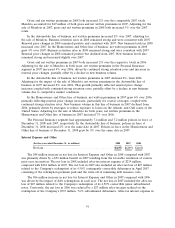
Claims and claim adjustment expenses totaled $1.74 billion in 2007, a decrease of 3% from 2006,
primarily reflecting an increase in net favorable prior year reserve development and the impact of the
sale of Afianzadora Insurgentes, partially offset by the increase in business volume, $37 million of
non-catastrophe losses incurred in the United Kingdom in 2007 related to flooding and the impact of
foreign currency rates of exchange. Net favorable prior year reserve development in 2006 totaled
$14 million.
General and administrative expenses in 2008 totaled $581 million, $9 million lower than in 2007,
primarily reflecting a decrease in commission expense. The Company’s implementation of the new fixed
85