Travelers 2008 Annual Report Download - page 202
Download and view the complete annual report
Please find page 202 of the 2008 Travelers annual report below. You can navigate through the pages in the report by either clicking on the pages listed below, or by using the keyword search tool below to find specific information within the annual report.-
 1
1 -
2
-
3
-
4
-
5
-
6
-
7
-
8
-
9
-
10
-
11
-
12
-
13
-
14
-
15
-
16
-
17
-
18
-
19
-
20
-
21
-
22
-
23
-
24
-
25
-
26
-
27
-
28
-
29
-
30
-
31
-
32
-
33
-
34
-
35
-
36
-
37
-
38
-
39
-
40
-
41
-
42
-
43
-
44
-
45
-
46
-
47
-
48
-
49
-
50
-
51
-
52
-
53
-
54
-
55
-
56
-
57
-
58
-
59
-
60
-
61
-
62
-
63
-
64
-
65
-
66
-
67
-
68
-
69
-
70
-
71
-
72
-
73
-
74
-
75
-
76
-
77
-
78
-
79
-
80
-
81
-
82
-
83
-
84
-
85
-
86
-
87
-
88
-
89
-
90
-
91
-
92
-
93
-
94
-
95
-
96
-
97
-
98
-
99
-
100
-
101
-
102
-
103
-
104
-
105
-
106
-
107
-
108
-
109
-
110
-
111
-
112
-
113
-
114
-
115
-
116
-
117
-
118
-
119
-
120
-
121
-
122
-
123
-
124
-
125
-
126
-
127
-
128
-
129
-
130
-
131
-
132
-
133
-
134
-
135
-
136
-
137
-
138
-
139
-
140
-
141
-
142
-
143
-
144
-
145
-
146
-
147
-
148
-
149
-
150
-
151
-
152
-
153
-
154
-
155
-
156
-
157
-
158
-
159
-
160
-
161
-
162
-
163
-
164
-
165
-
166
-
167
-
168
-
169
-
170
-
171
-
172
-
173
-
174
-
175
-
176
-
177
-
178
-
179
-
180
-
181
-
182
-
183
-
184
-
185
-
186
-
187
-
188
-
189
-
190
-
191
-
 192
192 -
 193
193 -
 194
194 -
 195
195 -
 196
196 -
 197
197 -
 198
198 -
 199
199 -
 200
200 -
 201
201 -
 202
202 -
 203
203 -
 204
204 -
 205
205 -
 206
206 -
 207
207 -
 208
208 -
 209
209 -
 210
210 -
 211
211 -
 212
212 -
213
-
214
-
215
-
216
-
217
-
218
-
219
-
220
-
221
-
222
-
223
-
224
-
225
-
226
-
227
-
228
-
229
-
230
-
231
-
232
-
233
-
234
-
235
-
236
-
237
-
238
-
239
-
240
-
241
-
242
-
243
-
244
-
245
-
246
-
247
-
248
-
249
-
250
-
251
-
252
-
253
-
254
-
255
-
256
-
257
-
258
-
259
-
260
-
261
-
262
-
263
-
264
-
265
-
266
-
267
-
268
-
269
-
270
-
271
-
272
-
273
-
274
-
275
-
276
-
277
-
278
-
279
-
280
-
281
-
282
-
283
-
284
-
285
-
286
-
287
-
288
 |
 |

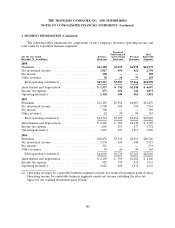
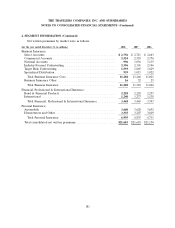
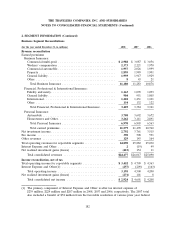
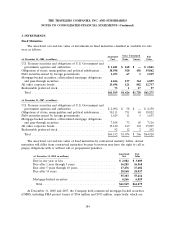
THE TRAVELERS COMPANIES, INC. AND SUBSIDIARIES
NOTES TO CONSOLIDATED FINANCIAL STATEMENTS (Continued)
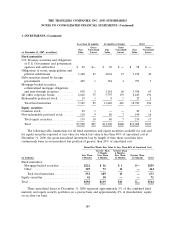
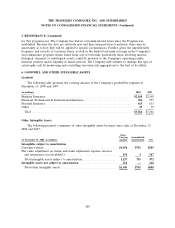
3. INVESTMENTS (Continued)
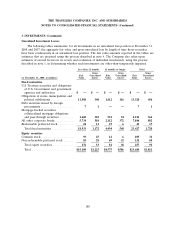
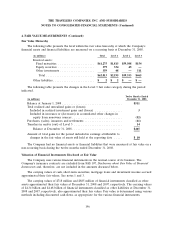
Impairment Charges
Impairment charges included in net realized investment gains (losses) were as follows:
(for the year ended December 31, in millions) 2008 2007 2006
Fixed maturities .................................... $324 $37 $ 7
Equity securities .................................... 74 74
Other investments ................................... 22 26 37
Total ........................................... $420 $70 $48
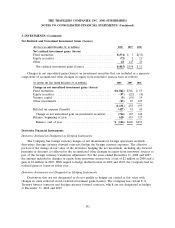
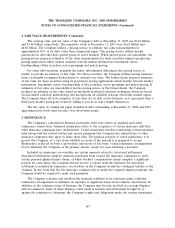
Concentrations and Credit Quality
At December 31, 2008 and 2007, the Company had concentrations of credit risk in state, municipal
and political subdivision obligations from the following states: Texas, $3.73 billion and $3.45 billion,
respectively; California, $1.99 billion and $2.07 billion, respectively; and Illinois, $1.95 billion and
$1.93 billion, respectively. These concentrations exclude advance refunded and escrowed-to-maturity
bonds, which are bonds for which an irrevocable trust has been established to fund the remaining
payments of principal and interest. Such escrow accounts are verified as to their sufficiency by an
external auditor and almost exclusively involve U.S. Treasury securities. The Company does not have
any individually significant exposures.
Included in fixed maturities are below investment grade assets totaling $1.20 billion and
$1.64 billion at December 31, 2008 and 2007, respectively. The Company defines its below investment
grade assets as those securities rated below investment grade by external rating agencies, or the
equivalent by the Company when a public rating does not exist. Such assets include publicly traded
below investment grade bonds and certain other privately issued bonds that are classified as below
investment grade loans.
The Company monitors creditworthiness of counterparties to financial instruments by using
controls that include credit approvals, limits and other monitoring procedures.
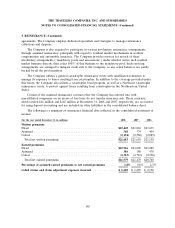
Net Investment Income
(for the year ended December 31, in millions) 2008 2007 2006
Gross investment income (loss)
Fixed maturities ............................... $2,915 $2,893 $2,738
Equity securities ............................... 31 29 30
Short-term securities ............................ 143 279 285
Real estate ................................... 39 57 38
Other investments ............................. (292) 562 489
Gross investment income ....................... 2,836 3,820 3,580
Investment expenses ............................ 44 59 63
Net investment income ........................ $2,792 $3,761 $3,517
190