Travelers 2008 Annual Report Download - page 130
Download and view the complete annual report
Please find page 130 of the 2008 Travelers annual report below. You can navigate through the pages in the report by either clicking on the pages listed below, or by using the keyword search tool below to find specific information within the annual report.-
 1
1 -
2
-
3
-
4
-
5
-
6
-
7
-
8
-
9
-
10
-
11
-
12
-
13
-
14
-
15
-
16
-
17
-
18
-
19
-
20
-
21
-
22
-
23
-
24
-
25
-
26
-
27
-
28
-
29
-
30
-
31
-
32
-
33
-
34
-
35
-
36
-
37
-
38
-
39
-
40
-
41
-
42
-
43
-
44
-
45
-
46
-
47
-
48
-
49
-
50
-
51
-
52
-
53
-
54
-
55
-
56
-
57
-
58
-
59
-
60
-
61
-
62
-
63
-
64
-
65
-
66
-
67
-
68
-
69
-
70
-
71
-
72
-
73
-
74
-
75
-
76
-
77
-
78
-
79
-
80
-
81
-
82
-
83
-
84
-
85
-
86
-
87
-
88
-
89
-
90
-
91
-
92
-
93
-
94
-
95
-
96
-
97
-
98
-
99
-
100
-
101
-
102
-
103
-
104
-
105
-
106
-
107
-
108
-
109
-
110
-
111
-
112
-
113
-
114
-
115
-
116
-
117
-
118
-
119
-
 120
120 -
 121
121 -
 122
122 -
 123
123 -
 124
124 -
 125
125 -
 126
126 -
 127
127 -
 128
128 -
 129
129 -
 130
130 -
 131
131 -
 132
132 -
 133
133 -
 134
134 -
 135
135 -
 136
136 -
 137
137 -
 138
138 -
 139
139 -
 140
140 -
141
-
142
-
143
-
144
-
145
-
146
-
147
-
148
-
149
-
150
-
151
-
152
-
153
-
154
-
155
-
156
-
157
-
158
-
159
-
160
-
161
-
162
-
163
-
164
-
165
-
166
-
167
-
168
-
169
-
170
-
171
-
172
-
173
-
174
-
175
-
176
-
177
-
178
-
179
-
180
-
181
-
182
-
183
-
184
-
185
-
186
-
187
-
188
-
189
-
190
-
191
-
192
-
193
-
194
-
195
-
196
-
197
-
198
-
199
-
200
-
201
-
202
-
203
-
204
-
205
-
206
-
207
-
208
-
209
-
210
-
211
-
212
-
213
-
214
-
215
-
216
-
217
-
218
-
219
-
220
-
221
-
222
-
223
-
224
-
225
-
226
-
227
-
228
-
229
-
230
-
231
-
232
-
233
-
234
-
235
-
236
-
237
-
238
-
239
-
240
-
241
-
242
-
243
-
244
-
245
-
246
-
247
-
248
-
249
-
250
-
251
-
252
-
253
-
254
-
255
-
256
-
257
-
258
-
259
-
260
-
261
-
262
-
263
-
264
-
265
-
266
-
267
-
268
-
269
-
270
-
271
-
272
-
273
-
274
-
275
-
276
-
277
-
278
-
279
-
280
-
281
-
282
-
283
-
284
-
285
-
286
-
287
-
288
 |
 |

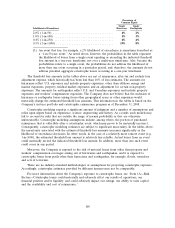
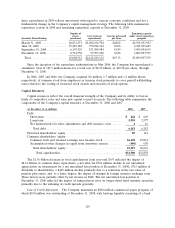
share repurchases in 2009 reflects uncertainty with regard to current economic conditions and not a
fundamental change in the Company’s capital management strategy. The following table summarizes
repurchase activity in 2008 and remaining repurchase capacity at December 31, 2008.
Number of Remaining capacity
shares Cost of shares Average price paid under share repurchase
Quarterly Period Ending purchased repurchased per share program
March 31, 2008 .............. 20,831,251 $1,000,332,704 $48.02 $4,931,853,967
June 30, 2008 ............... 15,287,182 750,014,344 49.06 4,181,839,623
September 30, 2008 ........... 6,197,529 271,984,984 43.89 3,909,854,639
December 31, 2008 ........... 2,712,550 99,997,100 36.86 3,809,857,539
Total .................... 45,028,512 $2,122,329,132 $47.13 $3,809,857,539
Since the inception of the repurchase authorizations in May 2006, the Company has repurchased a
cumulative total of 123.9 million shares for a total cost of $6.19 billion, or $49.98 per share, through
December 31, 2008.
In 2008, 2007 and 2006, the Company acquired 0.8 million, 1.7 million and 1.2 million shares,
respectively, of common stock from employees as treasury stock primarily to cover payroll withholding
taxes related to the vesting of restricted stock awards and exercises of stock options.
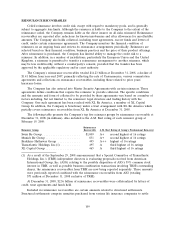
Capital Resources
Capital resources reflect the overall financial strength of the Company and its ability to borrow
funds at competitive rates and raise new capital to meet its needs. The following table summarizes the
components of the Company’s capital structure at December 31, 2008 and 2007.
(at December 31, in millions) 2008 2007
Debt:
Short-term ............................................. $ 242 $ 649
Long-term ............................................. 5,938 5,577
Net unamortized fair value adjustments and debt issuance costs ...... 116
Total debt ............................................ 6,181 6,242
Preferred shareholders’ equity ................................ 89 112
Common shareholders’ equity:
Common stock and retained earnings, less treasury stock ........... 26,130 25,834
Accumulated other changes in equity from nonowner sources ........ (900) 670
Total shareholders’ equity ................................ 25,319 26,616
Total capitalization .................................... $31,500 $32,858
The $1.36 billion decrease in total capitalization from year-end 2007 reflected the impact of
$2.12 billion of common share repurchases, a net after-tax $764 million decline in net unrealized
appreciation on investments (to a net unrealized loss position at December 31, 2008), $715 million of
dividends to shareholders, a $405 million decline primarily due to a reduction in the fair value of
pension plan assets, and, to a lesser degree, the impact of changes in foreign currency exchange rates.
These factors were partially offset by net income in 2008. The net unrealized loss position at
December 31, 2008 reflected the impact of rising interest rates on longer-dated fixed maturity securities
primarily due to the widening of credit spreads generally.
Line of Credit Agreement. The Company maintains an $800 million commercial paper program, of
which $100 million was outstanding at December 31, 2008, with back-up liquidity consisting of a bank
118