Travelers 2008 Annual Report Download - page 197
Download and view the complete annual report
Please find page 197 of the 2008 Travelers annual report below. You can navigate through the pages in the report by either clicking on the pages listed below, or by using the keyword search tool below to find specific information within the annual report.-
 1
1 -
2
-
3
-
4
-
5
-
6
-
7
-
8
-
9
-
10
-
11
-
12
-
13
-
14
-
15
-
16
-
17
-
18
-
19
-
20
-
21
-
22
-
23
-
24
-
25
-
26
-
27
-
28
-
29
-
30
-
31
-
32
-
33
-
34
-
35
-
36
-
37
-
38
-
39
-
40
-
41
-
42
-
43
-
44
-
45
-
46
-
47
-
48
-
49
-
50
-
51
-
52
-
53
-
54
-
55
-
56
-
57
-
58
-
59
-
60
-
61
-
62
-
63
-
64
-
65
-
66
-
67
-
68
-
69
-
70
-
71
-
72
-
73
-
74
-
75
-
76
-
77
-
78
-
79
-
80
-
81
-
82
-
83
-
84
-
85
-
86
-
87
-
88
-
89
-
90
-
91
-
92
-
93
-
94
-
95
-
96
-
97
-
98
-
99
-
100
-
101
-
102
-
103
-
104
-
105
-
106
-
107
-
108
-
109
-
110
-
111
-
112
-
113
-
114
-
115
-
116
-
117
-
118
-
119
-
120
-
121
-
122
-
123
-
124
-
125
-
126
-
127
-
128
-
129
-
130
-
131
-
132
-
133
-
134
-
135
-
136
-
137
-
138
-
139
-
140
-
141
-
142
-
143
-
144
-
145
-
146
-
147
-
148
-
149
-
150
-
151
-
152
-
153
-
154
-
155
-
156
-
157
-
158
-
159
-
160
-
161
-
162
-
163
-
164
-
165
-
166
-
167
-
168
-
169
-
170
-
171
-
172
-
173
-
174
-
175
-
176
-
177
-
178
-
179
-
180
-
181
-
182
-
183
-
184
-
185
-
186
-
 187
187 -
 188
188 -
 189
189 -
 190
190 -
 191
191 -
 192
192 -
 193
193 -
 194
194 -
 195
195 -
 196
196 -
 197
197 -
 198
198 -
 199
199 -
 200
200 -
 201
201 -
 202
202 -
 203
203 -
 204
204 -
 205
205 -
 206
206 -
 207
207 -
208
-
209
-
210
-
211
-
212
-
213
-
214
-
215
-
216
-
217
-
218
-
219
-
220
-
221
-
222
-
223
-
224
-
225
-
226
-
227
-
228
-
229
-
230
-
231
-
232
-
233
-
234
-
235
-
236
-
237
-
238
-
239
-
240
-
241
-
242
-
243
-
244
-
245
-
246
-
247
-
248
-
249
-
250
-
251
-
252
-
253
-
254
-
255
-
256
-
257
-
258
-
259
-
260
-
261
-
262
-
263
-
264
-
265
-
266
-
267
-
268
-
269
-
270
-
271
-
272
-
273
-
274
-
275
-
276
-
277
-
278
-
279
-
280
-
281
-
282
-
283
-
284
-
285
-
286
-
287
-
288
 |
 |
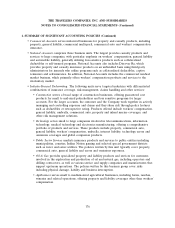
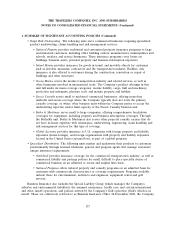
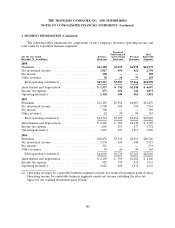
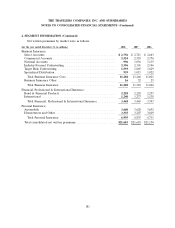
THE TRAVELERS COMPANIES, INC. AND SUBSIDIARIES
NOTES TO CONSOLIDATED FINANCIAL STATEMENTS (Continued)
3. INVESTMENTS (Continued)
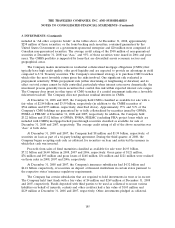
included in ‘‘All other corporate bonds’’ in the tables above. At December 31, 2008, approximately
$258 million of these securities, or the loans backing such securities, contained guarantees by the
United States Government or a government-sponsored enterprise and $20 million were comprised of
Canadian non-guaranteed securities. The average credit rating of the $508 million of non-guaranteed
securities at December 31, 2008 was ‘‘Aaa,’’ and 93% of those securities were issued in 2004 and prior
years. The CMBS portfolio is supported by loans that are diversified across economic sectors and
geographical areas.
The Company makes investments in residential collateralized mortgage obligations (CMOs) that
typically have high credit quality, offer good liquidity and are expected to provide an advantage in yield
compared to U.S. Treasury securities. The Company’s investment strategy is to purchase CMO tranches
which offer the most favorable return given the risks involved. One significant risk evaluated is
prepayment sensitivity. While prepayment risk (either shortening or lengthening of duration) and its
effect on total return cannot be fully controlled, particularly when interest rates move dramatically, the
investment process generally favors securities that control this risk within expected interest rate ranges.
The Company does invest in other types of CMO tranches if a careful assessment indicates a favorable
risk/return tradeoff. The Company does not purchase residual interests in CMOs.
At December 31, 2008 and 2007, the Company held CMOs classified as available for sale with a
fair value of $2.84 billion and $3.59 billion, respectively (in addition to the CMBS securities of
$766 million and $935 million, respectively, described above). Approximately 35% and 31% of the
Company’s CMO holdings are guaranteed by or fully collateralized by securities issued by GNMA,
FNMA or FHLMC at December 31, 2008 and 2007, respectively. In addition, the Company held
$3.22 billion and $3.52 billion of GNMA, FNMA, FHLMC (excluding FHA project loans which are
included with CMBS) mortgage-backed pass-through securities classified as available for sale at
December 31, 2008 and 2007, respectively. The average credit rating of all of the above securities was
‘‘Aaa’’ at both dates.
At December 31, 2008 and 2007, the Company had $8 million and $1.99 billion, respectively, of
securities on loan as part of a tri-party lending agreement. During the third quarter of 2008, the
Company began accepting only cash as collateral for securities on loan and restricted the manner in
which that cash was invested.
Proceeds from sales of fixed maturities classified as available for sale were $6.93 billion,
$7.32 billion and $4.40 billion in 2008, 2007 and 2006, respectively. Gross gains of $121 million,
$76 million and $95 million and gross losses of $168 million, $34 million and $121 million were realized
on those sales in 2008, 2007 and 2006, respectively.
At December 31, 2008 and 2007, the Company’s insurance subsidiaries had $4.32 billion and
$4.21 billion, respectively, of securities on deposit at financial institutions in certain states pursuant to
the respective states’ insurance regulatory requirements.
The Company has certain subsidiaries that are required to hold investments in trust or in escrow.
The Company held trust funds with a fair value of $4 million and $269 million at December 31, 2008
and 2007, respectively. Funds deposited with third parties to be used as collateral to secure various
liabilities on behalf of insureds, cedants and other creditors had a fair value of $105 million and
$129 million at December 31, 2008 and 2007, respectively. Other investments pledged as collateral
185