Travelers 2008 Annual Report Download - page 30
Download and view the complete annual report
Please find page 30 of the 2008 Travelers annual report below. You can navigate through the pages in the report by either clicking on the pages listed below, or by using the keyword search tool below to find specific information within the annual report.-
 1
1 -
2
-
3
-
4
-
5
-
6
-
7
-
8
-
9
-
10
-
11
-
12
-
13
-
14
-
15
-
16
-
17
-
18
-
19
-
 20
20 -
 21
21 -
 22
22 -
 23
23 -
 24
24 -
 25
25 -
 26
26 -
 27
27 -
 28
28 -
 29
29 -
 30
30 -
 31
31 -
 32
32 -
 33
33 -
 34
34 -
 35
35 -
 36
36 -
 37
37 -
 38
38 -
 39
39 -
 40
40 -
41
-
42
-
43
-
44
-
45
-
46
-
47
-
48
-
49
-
50
-
51
-
52
-
53
-
54
-
55
-
56
-
57
-
58
-
59
-
60
-
61
-
62
-
63
-
64
-
65
-
66
-
67
-
68
-
69
-
70
-
71
-
72
-
73
-
74
-
75
-
76
-
77
-
78
-
79
-
80
-
81
-
82
-
83
-
84
-
85
-
86
-
87
-
88
-
89
-
90
-
91
-
92
-
93
-
94
-
95
-
96
-
97
-
98
-
99
-
100
-
101
-
102
-
103
-
104
-
105
-
106
-
107
-
108
-
109
-
110
-
111
-
112
-
113
-
114
-
115
-
116
-
117
-
118
-
119
-
120
-
121
-
122
-
123
-
124
-
125
-
126
-
127
-
128
-
129
-
130
-
131
-
132
-
133
-
134
-
135
-
136
-
137
-
138
-
139
-
140
-
141
-
142
-
143
-
144
-
145
-
146
-
147
-
148
-
149
-
150
-
151
-
152
-
153
-
154
-
155
-
156
-
157
-
158
-
159
-
160
-
161
-
162
-
163
-
164
-
165
-
166
-
167
-
168
-
169
-
170
-
171
-
172
-
173
-
174
-
175
-
176
-
177
-
178
-
179
-
180
-
181
-
182
-
183
-
184
-
185
-
186
-
187
-
188
-
189
-
190
-
191
-
192
-
193
-
194
-
195
-
196
-
197
-
198
-
199
-
200
-
201
-
202
-
203
-
204
-
205
-
206
-
207
-
208
-
209
-
210
-
211
-
212
-
213
-
214
-
215
-
216
-
217
-
218
-
219
-
220
-
221
-
222
-
223
-
224
-
225
-
226
-
227
-
228
-
229
-
230
-
231
-
232
-
233
-
234
-
235
-
236
-
237
-
238
-
239
-
240
-
241
-
242
-
243
-
244
-
245
-
246
-
247
-
248
-
249
-
250
-
251
-
252
-
253
-
254
-
255
-
256
-
257
-
258
-
259
-
260
-
261
-
262
-
263
-
264
-
265
-
266
-
267
-
268
-
269
-
270
-
271
-
272
-
273
-
274
-
275
-
276
-
277
-
278
-
279
-
280
-
281
-
282
-
283
-
284
-
285
-
286
-
287
-
288
 |
 |

Product Lines
The primary coverages in Personal Insurance are personal automobile and homeowners insurance
sold to individuals. Personal Insurance had approximately 7.4 million policies in force at December 31,
2008.
Personal Automobile provides coverage for liability to others for both bodily injury and property
damage and for physical damage to an insured’s own vehicle from collision and various other perils. In
addition, many states require policies to provide first-party personal injury protection, frequently
referred to as no-fault coverage.
Homeowners and Other provides protection against losses to dwellings and contents from a wide
variety of perils (excluding flooding), as well as coverage for personal liability. The Company writes
homeowners insurance for dwellings, condominiums and rental property contents. The Company also
writes coverage for personal watercraft, personal articles such as jewelry, and umbrella liability
protection.
Net Retention Policy
The following discussion reflects the Company’s retention policy with respect to the Personal
Insurance segment as of January 1, 2009. Personal Insurance retains the first $5.0 million of umbrella
policies and purchases facultative reinsurance for limits over $5.0 million. For personal property
insurance, there is a $7.0 million maximum retention per risk. The Company utilizes facultative
reinsurance to provide additional limits capacity or to reduce retentions on an individual risk basis. The
Company may also retain amounts greater than those described herein based upon the individual
characteristics of the risk.
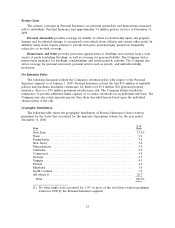
Geographic Distribution
The following table shows the geographic distribution of Personal Insurance’s direct written
premiums for the states that accounted for the majority of premium volume for the year ended
December 31, 2008:
% of
State Total
New York ................................................. 15.1%
Texas ..................................................... 9.2
Pennsylvania ................................................ 7.6
New Jersey ................................................ 5.8
Massachusetts .............................................. 5.4
California .................................................. 5.0
Connecticut ................................................ 4.8
Georgia ................................................... 4.7
Virginia ................................................... 4.5
Florida ................................................... 4.4
Maryland .................................................. 3.6
South Carolina .............................................. 3.2
All others(1) ............................................... 26.7
Total ................................................... 100.0%
(1) No other single state accounted for 3.0% or more of the total direct written premiums
written in 2008 by the Personal Insurance segment.
18