Travelers 2008 Annual Report Download - page 93
Download and view the complete annual report
Please find page 93 of the 2008 Travelers annual report below. You can navigate through the pages in the report by either clicking on the pages listed below, or by using the keyword search tool below to find specific information within the annual report.-
 1
1 -
 2
2 -
 3
3 -
 4
4 -
 5
5 -
 6
6 -
 7
7 -
 8
8 -
 9
9 -
 10
10 -
 11
11 -
 12
12 -
 13
13 -
 14
14 -
 15
15 -
 16
16 -
 17
17 -
 18
18 -
 19
19 -
 20
20 -
 21
21 -
 22
22 -
 23
23 -
 24
24 -
 25
25 -
 26
26 -
 27
27 -
 28
28 -
 29
29 -
 30
30 -
 31
31 -
 32
32 -
 33
33 -
 34
34 -
 35
35 -
 36
36 -
 37
37 -
 38
38 -
 39
39 -
 40
40 -
 41
41 -
 42
42 -
 43
43 -
 44
44 -
 45
45 -
 46
46 -
 47
47 -
 48
48 -
 49
49 -
 50
50 -
 51
51 -
 52
52 -
 53
53 -
 54
54 -
 55
55 -
 56
56 -
 57
57 -
 58
58 -
 59
59 -
 60
60 -
 61
61 -
 62
62 -
 63
63 -
 64
64 -
 65
65 -
 66
66 -
 67
67 -
 68
68 -
 69
69 -
 70
70 -
 71
71 -
 72
72 -
 73
73 -
 74
74 -
 75
75 -
 76
76 -
 77
77 -
 78
78 -
 79
79 -
 80
80 -
 81
81 -
 82
82 -
 83
83 -
 84
84 -
 85
85 -
 86
86 -
 87
87 -
 88
88 -
 89
89 -
 90
90 -
 91
91 -
 92
92 -
 93
93 -
 94
94 -
 95
95 -
 96
96 -
 97
97 -
 98
98 -
 99
99 -
 100
100 -
 101
101 -
 102
102 -
 103
103 -
 104
104 -
 105
105 -
 106
106 -
 107
107 -
 108
108 -
 109
109 -
 110
110 -
 111
111 -
 112
112 -
 113
113 -
 114
114 -
 115
115 -
 116
116 -
 117
117 -
 118
118 -
 119
119 -
 120
120 -
 121
121 -
 122
122 -
 123
123 -
 124
124 -
 125
125 -
 126
126 -
 127
127 -
 128
128 -
 129
129 -
 130
130 -
 131
131 -
 132
132 -
 133
133 -
 134
134 -
 135
135 -
 136
136 -
 137
137 -
 138
138 -
 139
139 -
 140
140 -
 141
141 -
 142
142 -
 143
143 -
 144
144 -
 145
145 -
 146
146 -
 147
147 -
 148
148 -
 149
149 -
 150
150 -
 151
151 -
 152
152 -
 153
153 -
 154
154 -
 155
155 -
 156
156 -
 157
157 -
 158
158 -
 159
159 -
 160
160 -
 161
161 -
 162
162 -
 163
163 -
 164
164 -
 165
165 -
 166
166 -
 167
167 -
 168
168 -
 169
169 -
 170
170 -
 171
171 -
 172
172 -
 173
173 -
 174
174 -
 175
175 -
 176
176 -
 177
177 -
 178
178 -
 179
179 -
 180
180 -
 181
181 -
 182
182 -
 183
183 -
 184
184 -
 185
185 -
 186
186 -
 187
187 -
 188
188 -
 189
189 -
 190
190 -
 191
191 -
 192
192 -
 193
193 -
 194
194 -
 195
195 -
 196
196 -
 197
197 -
 198
198 -
 199
199 -
 200
200 -
 201
201 -
 202
202 -
 203
203 -
 204
204 -
 205
205 -
 206
206 -
 207
207 -
 208
208 -
 209
209 -
 210
210 -
 211
211 -
 212
212 -
 213
213 -
 214
214 -
 215
215 -
 216
216 -
 217
217 -
 218
218 -
 219
219 -
 220
220 -
 221
221 -
 222
222 -
 223
223 -
 224
224 -
 225
225 -
 226
226 -
 227
227 -
 228
228 -
 229
229 -
 230
230 -
 231
231 -
 232
232 -
 233
233 -
 234
234 -
 235
235 -
 236
236 -
 237
237 -
 238
238 -
 239
239 -
 240
240 -
 241
241 -
 242
242 -
 243
243 -
 244
244 -
 245
245 -
 246
246 -
 247
247 -
 248
248 -
 249
249 -
 250
250 -
 251
251 -
 252
252 -
 253
253 -
 254
254 -
 255
255 -
 256
256 -
 257
257 -
 258
258 -
 259
259 -
 260
260 -
 261
261 -
 262
262 -
 263
263 -
 264
264 -
 265
265 -
 266
266 -
 267
267 -
 268
268 -
 269
269 -
 270
270 -
 271
271 -
 272
272 -
 273
273 -
 274
274 -
 275
275 -
 276
276 -
 277
277 -
 278
278 -
 279
279 -
 280
280 -
 281
281 -
 282
282 -
 283
283 -
 284
284 -
 285
285 -
 286
286 -
 287
287 -
 288
288
 |
 |

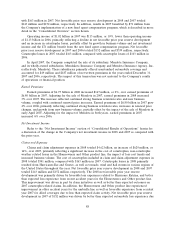
GAAP Combined Ratio
The loss and loss adjustment expense ratio in 2008 of 57.7% was 0.6 points higher than the
comparable 2007 ratio of 57.1%. The cost of catastrophes accounted for 5.7 points of the loss and loss
adjustment expense ratio in 2008, compared with no impact from catastrophes in 2007. Net favorable
prior year reserve development provided 10.0 point and 2.6 point benefits to the loss and loss
adjustment expense ratio in 2008 and 2007, respectively. The 2008 loss and loss adjustment expense
ratio adjusted for the cost of catastrophes and prior year reserve development was 2.3 points higher
than the 2007 ratio on the same basis, reflecting the impact of competitive market conditions on pricing
over the preceding twelve months and loss cost trends, as well as a small increase in the number of
large property losses.
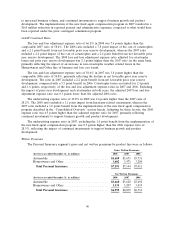
The loss and loss adjustment expense ratio of 57.1% in 2007 was 3.2 points lower than the
comparable 2006 ratio of 60.3%. In 2007, net favorable prior year reserve development provided a 2.6
point benefit to the loss and loss adjustment expense ratio, whereas the 2006 loss and loss adjustment
expense ratio included a 0.2 point benefit from net favorable prior year reserve development. Adjusting
for the impact of prior year reserve development in both years, the loss and loss adjustment expense
ratio in 2007 was 0.8 points better than the comparable 2006 ratio, reflecting favorable current accident
year results in 2007.
The underwriting expense ratio of 32.5% in 2008 was 1.8 points higher than the comparable 2007
ratio of 30.7%. The 2008 expense ratio included a 0.6 point impact of the hurricane-related
assessments, whereas the 2007 ratio included a 0.7 point benefit from the implementation of the new
fixed agent compensation program described in the ‘‘Consolidated Overview’’ section herein. Adjusting
for these factors in both years, the adjusted 2008 expense ratio was 0.5 points higher than the adjusted
expense ratio for 2007, primarily reflecting continued investments to support business growth and
product development, the impact of a decline in the rate of earned premium growth relative to expense
growth, and declines in fee income. A portion of fee income is accounted for as a reduction of
expenses for purposes of calculating the expense ratio.
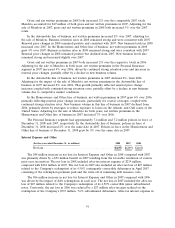
The underwriting expense ratio of 30.7% in 2007, which included a 0.7 point benefit resulting from
the implementation of the new fixed agent compensation program, was 0.1 points higher than the 2006
ratio, reflecting the increases in general and administrative expenses described above, and the impact of
a decline in fee income.
Written Premiums
The Business Insurance segment’s gross and net written premiums by market were as follows:
Gross Written Premiums
(for the year ended December 31, in millions) 2008 2007 2006
Select Accounts ............................. $ 2,804 $ 2,774 $ 2,733
Commercial Accounts ........................ 2,729 2,740 2,613
National Accounts ........................... 1,577 1,859 2,169
Industry-Focused Underwriting .................. 2,485 2,380 2,279
Target Risk Underwriting ...................... 2,029 2,182 2,187
Specialized Distribution ....................... 954 1,033 1,036
Total Business Insurance Core ................ 12,578 12,968 13,017
Business Insurance Other ...................... 249 30
Total Business Insurance .................... $12,580 $13,017 $13,047
81
