Travelers 2008 Annual Report Download - page 116
Download and view the complete annual report
Please find page 116 of the 2008 Travelers annual report below. You can navigate through the pages in the report by either clicking on the pages listed below, or by using the keyword search tool below to find specific information within the annual report.-
 1
1 -
2
-
3
-
4
-
5
-
6
-
7
-
8
-
9
-
10
-
11
-
12
-
13
-
14
-
15
-
16
-
17
-
18
-
19
-
20
-
21
-
22
-
23
-
24
-
25
-
26
-
27
-
28
-
29
-
30
-
31
-
32
-
33
-
34
-
35
-
36
-
37
-
38
-
39
-
40
-
41
-
42
-
43
-
44
-
45
-
46
-
47
-
48
-
49
-
50
-
51
-
52
-
53
-
54
-
55
-
56
-
57
-
58
-
59
-
60
-
61
-
62
-
63
-
64
-
65
-
66
-
67
-
68
-
69
-
70
-
71
-
72
-
73
-
74
-
75
-
76
-
77
-
78
-
79
-
80
-
81
-
82
-
83
-
84
-
85
-
86
-
87
-
88
-
89
-
90
-
91
-
92
-
93
-
94
-
95
-
96
-
97
-
98
-
99
-
100
-
101
-
102
-
103
-
104
-
105
-
 106
106 -
 107
107 -
 108
108 -
 109
109 -
 110
110 -
 111
111 -
 112
112 -
 113
113 -
 114
114 -
 115
115 -
 116
116 -
 117
117 -
 118
118 -
 119
119 -
 120
120 -
 121
121 -
 122
122 -
 123
123 -
 124
124 -
 125
125 -
 126
126 -
127
-
128
-
129
-
130
-
131
-
132
-
133
-
134
-
135
-
136
-
137
-
138
-
139
-
140
-
141
-
142
-
143
-
144
-
145
-
146
-
147
-
148
-
149
-
150
-
151
-
152
-
153
-
154
-
155
-
156
-
157
-
158
-
159
-
160
-
161
-
162
-
163
-
164
-
165
-
166
-
167
-
168
-
169
-
170
-
171
-
172
-
173
-
174
-
175
-
176
-
177
-
178
-
179
-
180
-
181
-
182
-
183
-
184
-
185
-
186
-
187
-
188
-
189
-
190
-
191
-
192
-
193
-
194
-
195
-
196
-
197
-
198
-
199
-
200
-
201
-
202
-
203
-
204
-
205
-
206
-
207
-
208
-
209
-
210
-
211
-
212
-
213
-
214
-
215
-
216
-
217
-
218
-
219
-
220
-
221
-
222
-
223
-
224
-
225
-
226
-
227
-
228
-
229
-
230
-
231
-
232
-
233
-
234
-
235
-
236
-
237
-
238
-
239
-
240
-
241
-
242
-
243
-
244
-
245
-
246
-
247
-
248
-
249
-
250
-
251
-
252
-
253
-
254
-
255
-
256
-
257
-
258
-
259
-
260
-
261
-
262
-
263
-
264
-
265
-
266
-
267
-
268
-
269
-
270
-
271
-
272
-
273
-
274
-
275
-
276
-
277
-
278
-
279
-
280
-
281
-
282
-
283
-
284
-
285
-
286
-
287
-
288
 |
 |

Company’s securities is in default under the lending agreement. Therefore, the Company does not
recognize the receipt of the collateral held by the third-party custodian or the obligation to return the
collateral. The loaned securities remain a recorded asset of the Company.
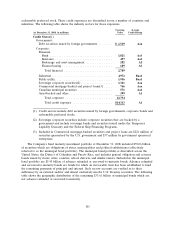
During the third quarter of 2008, the Company changed its securities lending requirements in light
of the recent market conditions to accept only cash as collateral for securities on loan and restricted
the manner in which that cash was invested. These actions resulted in a significant reduction in the
amount of securities on loan. At December 31, 2008, the Company had $8 million of securities on loan
to others, compared with $1.99 billion at December 31, 2007. The Company has not incurred any
investment losses in its securities lending program for the years ended December 31, 2008, 2007 and
2006.
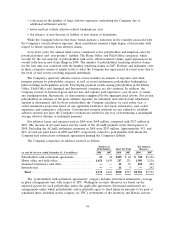
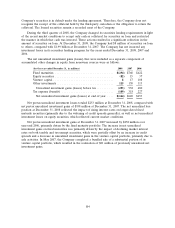
The net unrealized investment gains (losses) that were included as a separate component of
accumulated other changes in equity from nonowner sources were as follows:
(for the year ended December 31, in millions) 2008 2007 2006
Fixed maturities .................................. $(294) $768 $422
Equity securities .................................. (82) 15 37
Venture capital ................................... 817 108
Other investments ................................. 115 138 113
Unrealized investment gains (losses) before tax .......... (253) 938 680
Tax expense (benefit) .............................. (109) 318 227
Net unrealized investment gains (losses) at end of year .... $(144) $620 $453
Net pretax unrealized investment losses totaled $253 million at December 31, 2008, compared with
net pretax unrealized investment gains of $938 million at December 31, 2007. The net unrealized loss
position at December 31, 2008 reflected the impact of rising interest rates on longer-dated fixed
maturity securities (primarily due to the widening of credit spreads generally), as well as net unrealized
investment losses on equity securities, which reflected current market conditions.
Net pretax unrealized investment gains at December 31, 2007 increased by $258 million over
year-end 2006, primarily driven by the fixed maturity portfolio. The increase in net unrealized
investment gains on fixed maturities was primarily driven by the impact of declining market interest
rates on both taxable and tax-exempt securities, which were partially offset by an increase in credit
spreads and a decrease in unrealized investment gains in the venture capital portfolio, primarily due to
sale activities. In May 2007, the Company completed a bundled sale of a substantial portion of its
venture capital portfolio, which resulted in the realization of $81 million of previously unrealized net
investment gains.
104