Travelers 2008 Annual Report Download - page 115
Download and view the complete annual report
Please find page 115 of the 2008 Travelers annual report below. You can navigate through the pages in the report by either clicking on the pages listed below, or by using the keyword search tool below to find specific information within the annual report.-
 1
1 -
2
-
3
-
4
-
5
-
6
-
7
-
8
-
9
-
10
-
11
-
12
-
13
-
14
-
15
-
16
-
17
-
18
-
19
-
20
-
21
-
22
-
23
-
24
-
25
-
26
-
27
-
28
-
29
-
30
-
31
-
32
-
33
-
34
-
35
-
36
-
37
-
38
-
39
-
40
-
41
-
42
-
43
-
44
-
45
-
46
-
47
-
48
-
49
-
50
-
51
-
52
-
53
-
54
-
55
-
56
-
57
-
58
-
59
-
60
-
61
-
62
-
63
-
64
-
65
-
66
-
67
-
68
-
69
-
70
-
71
-
72
-
73
-
74
-
75
-
76
-
77
-
78
-
79
-
80
-
81
-
82
-
83
-
84
-
85
-
86
-
87
-
88
-
89
-
90
-
91
-
92
-
93
-
94
-
95
-
96
-
97
-
98
-
99
-
100
-
101
-
102
-
103
-
104
-
 105
105 -
 106
106 -
 107
107 -
 108
108 -
 109
109 -
 110
110 -
 111
111 -
 112
112 -
 113
113 -
 114
114 -
 115
115 -
 116
116 -
 117
117 -
 118
118 -
 119
119 -
 120
120 -
 121
121 -
 122
122 -
 123
123 -
 124
124 -
 125
125 -
126
-
127
-
128
-
129
-
130
-
131
-
132
-
133
-
134
-
135
-
136
-
137
-
138
-
139
-
140
-
141
-
142
-
143
-
144
-
145
-
146
-
147
-
148
-
149
-
150
-
151
-
152
-
153
-
154
-
155
-
156
-
157
-
158
-
159
-
160
-
161
-
162
-
163
-
164
-
165
-
166
-
167
-
168
-
169
-
170
-
171
-
172
-
173
-
174
-
175
-
176
-
177
-
178
-
179
-
180
-
181
-
182
-
183
-
184
-
185
-
186
-
187
-
188
-
189
-
190
-
191
-
192
-
193
-
194
-
195
-
196
-
197
-
198
-
199
-
200
-
201
-
202
-
203
-
204
-
205
-
206
-
207
-
208
-
209
-
210
-
211
-
212
-
213
-
214
-
215
-
216
-
217
-
218
-
219
-
220
-
221
-
222
-
223
-
224
-
225
-
226
-
227
-
228
-
229
-
230
-
231
-
232
-
233
-
234
-
235
-
236
-
237
-
238
-
239
-
240
-
241
-
242
-
243
-
244
-
245
-
246
-
247
-
248
-
249
-
250
-
251
-
252
-
253
-
254
-
255
-
256
-
257
-
258
-
259
-
260
-
261
-
262
-
263
-
264
-
265
-
266
-
267
-
268
-
269
-
270
-
271
-
272
-
273
-
274
-
275
-
276
-
277
-
278
-
279
-
280
-
281
-
282
-
283
-
284
-
285
-
286
-
287
-
288
 |
 |
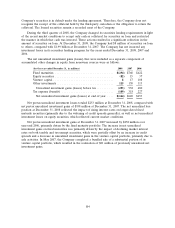
The Company makes investments in residential collateralized mortgage obligations (CMOs) that
typically have high credit quality, offer good liquidity and are expected to provide an advantage in yield
compared to U.S. Treasury securities. The Company’s investment strategy is to purchase CMO tranches
which offer the most favorable return given the risks involved. One significant risk evaluated is
prepayment sensitivity. While prepayment risk (either shortening or lengthening of duration) and its
effect on total return cannot be fully controlled, particularly when interest rates move dramatically, the
investment process generally favors securities that control this risk within expected interest rate ranges.
The Company does invest in other types of CMO tranches if a careful assessment indicates a favorable
risk/return tradeoff. The Company does not purchase residual interests in CMOs.
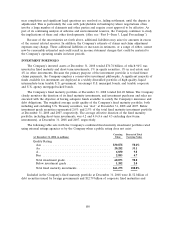
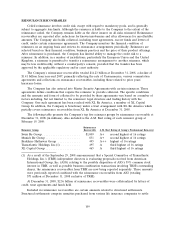
At December 31, 2008 and 2007, the Company held CMOs classified as available for sale with a
fair value of $2.84 billion and $3.59 billion, respectively (in addition to the CMBS securities of
$766 million and $935 million, respectively, described above). Approximately 35% and 31% of the
Company’s CMO holdings are guaranteed by or fully collateralized by securities issued by GNMA,
FNMA or FHLMC at December 31, 2008 and 2007, respectively. In addition, the Company held
$3.22 billion and $3.52 billion of GNMA, FNMA, FHLMC (excluding FHA project loans which are
included with CMBS) mortgage-backed pass-through securities classified as available for sale at
December 31, 2008 and 2007, respectively. The average credit rating of all of the above securities was
‘‘Aaa’’ at both dates.
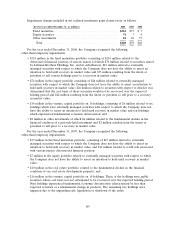
The Company’s fixed maturity investment portfolio at December 31, 2008 and 2007 included asset-
backed securities collateralized by sub-prime mortgages and collateralized mortgage obligations backed
by alternative documentation mortgages with a collective market value of $206 million and
$286 million, respectively (comprising approximately 0.3% and 0.4% of the Company’s total fixed
maturity investments, respectively). The disruption in secondary investment markets for mortgage-
backed securities provided the Company with the opportunity to selectively acquire additional asset-
backed securities collateralized by sub-prime mortgages at discounted prices. The Company purchased
$47 million and $89 million of such securities in 2008 and the fourth quarter of 2007, respectively. The
Company defines sub-prime mortgage-backed securities as investments in which the underlying loans
primarily exhibit one or more of the following characteristics: low FICO scores, above-prime interest
rates, high loan-to-value ratios or high debt-to-income ratios. Alternative documentation securitizations
are those in which the underlying loans primarily meet the government-sponsored entity’s requirements
for credit score but do not meet the government-sponsored entity’s guidelines for documentation,
property type, debt and loan-to-value ratios. The average credit rating on these securities and
obligations held by the Company was ‘‘Aa2’’ and ‘‘Aaa’’ at December 31, 2008 and 2007, respectively.
Approximately $81 million of the Company’s asset-backed securities collateralized by sub-prime and
alternative documentation mortgages were downgraded in 2008.
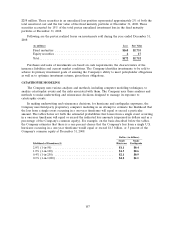
The Company’s real estate investments include warehouses and office buildings and other
commercial land and properties that are directly owned. The Company’s other investments are
primarily comprised of private equity limited partnerships, hedge funds, real estate partnerships, joint
ventures, mortgage loans, venture capital (through direct ownership and limited partnerships) and
trading securities, which are subject to more volatility than the Company’s fixed maturity investments.
While these asset classes have historically provided a higher return than fixed maturities, in 2008 the
returns were significantly lower than in prior periods and, in the aggregate, produced negative
investment income, reflecting market conditions. At December 31, 2008 and 2007, the carrying value of
the Company’s other investments was $3.04 billion and $3.37 billion, respectively.
The Company has engaged in securities lending activities from which it generates net investment
income from the lending of certain of its investments to other institutions for short periods of time.
Borrowers of these securities provide collateral equal to at least 102% of the market value of the
loaned securities plus accrued interest. This collateral is held by a third-party custodian, and the
Company has the right to access the collateral only in the event that the institution borrowing the
103