Travelers 2008 Annual Report Download - page 2
Download and view the complete annual report
Please find page 2 of the 2008 Travelers annual report below. You can navigate through the pages in the report by either clicking on the pages listed below, or by using the keyword search tool below to find specific information within the annual report.-
 1
1 -
 2
2 -
 3
3 -
 4
4 -
 5
5 -
 6
6 -
 7
7 -
 8
8 -
 9
9 -
 10
10 -
 11
11 -
 12
12 -
 13
13 -
14
-
15
-
16
-
17
-
18
-
19
-
20
-
21
-
22
-
23
-
24
-
25
-
26
-
27
-
28
-
29
-
30
-
31
-
32
-
33
-
34
-
35
-
36
-
37
-
38
-
39
-
40
-
41
-
42
-
43
-
44
-
45
-
46
-
47
-
48
-
49
-
50
-
51
-
52
-
53
-
54
-
55
-
56
-
57
-
58
-
59
-
60
-
61
-
62
-
63
-
64
-
65
-
66
-
67
-
68
-
69
-
70
-
71
-
72
-
73
-
74
-
75
-
76
-
77
-
78
-
79
-
80
-
81
-
82
-
83
-
84
-
85
-
86
-
87
-
88
-
89
-
90
-
91
-
92
-
93
-
94
-
95
-
96
-
97
-
98
-
99
-
100
-
101
-
102
-
103
-
104
-
105
-
106
-
107
-
108
-
109
-
110
-
111
-
112
-
113
-
114
-
115
-
116
-
117
-
118
-
119
-
120
-
121
-
122
-
123
-
124
-
125
-
126
-
127
-
128
-
129
-
130
-
131
-
132
-
133
-
134
-
135
-
136
-
137
-
138
-
139
-
140
-
141
-
142
-
143
-
144
-
145
-
146
-
147
-
148
-
149
-
150
-
151
-
152
-
153
-
154
-
155
-
156
-
157
-
158
-
159
-
160
-
161
-
162
-
163
-
164
-
165
-
166
-
167
-
168
-
169
-
170
-
171
-
172
-
173
-
174
-
175
-
176
-
177
-
178
-
179
-
180
-
181
-
182
-
183
-
184
-
185
-
186
-
187
-
188
-
189
-
190
-
191
-
192
-
193
-
194
-
195
-
196
-
197
-
198
-
199
-
200
-
201
-
202
-
203
-
204
-
205
-
206
-
207
-
208
-
209
-
210
-
211
-
212
-
213
-
214
-
215
-
216
-
217
-
218
-
219
-
220
-
221
-
222
-
223
-
224
-
225
-
226
-
227
-
228
-
229
-
230
-
231
-
232
-
233
-
234
-
235
-
236
-
237
-
238
-
239
-
240
-
241
-
242
-
243
-
244
-
245
-
246
-
247
-
248
-
249
-
250
-
251
-
252
-
253
-
254
-
255
-
256
-
257
-
258
-
259
-
260
-
261
-
262
-
263
-
264
-
265
-
266
-
267
-
268
-
269
-
270
-
271
-
272
-
273
-
274
-
275
-
276
-
277
-
278
-
279
-
280
-
281
-
282
-
283
-
284
-
285
-
286
-
287
-
288
 |
 |

2008 Annual Report
“We manage our business with long-term
returns and profitability in mind, which helps
to ensure that our risk-return equation is
disciplined and thoughtful. Our company is
more than 150 years old. Over this time, we
have experienced both significant successes
and failures, which have helped to develop
our strong institutional memory and an
appreciation for both good times and bad.
This experience and resulting philosophy
have kept our investment decisions straight-
forward and geared towards providing
consistent and appropriate risk-adjusted
returns over time, rather than responding
to the investment idea of the day. It also is
reflected in our underwriting operations,
where we underwrite risks with a long-term
and patient orientation.”
Jay S. Fishman
Chairman and Chief Executive Officer
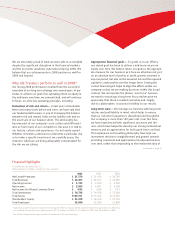
To Our Shareholders:
In 2008, the financial markets and the economy in the United
States and abroad experienced substantial disruption. Against
this challenging backdrop, Travelers delivered a successful year
in 2008, recording annual operating income of $3.2 billion and
an operating return on equity of 12.4 percent. We also stayed
on track to meet our long-term financial goal of achieving a
mid-teens return on equity over time. Since January 1, 2005,
the first full year following the Travelers-St. Paul merger, we
have achieved an average annual operating return on equity
of approximately 14.5 percent.
Critical to our success this year was the very strong perfor-
mance of our investment portfolio. Our long-standing,
disciplined approach to evaluating risk and reward helped us
to avoid significant losses from the asset classes that suffered
substantial declines over the past 12 to 18 months.
Another key contributor to our success was the solid underwrit-
ing performance in our business. For the year, we posted net
written premiums of $21.7 billion, slightly higher than in 2007.
Although pricing for our product declined somewhat on aver-
age, we continued to retain customers at historically high levels.
At the same time, we saw a healthy flow of new business, driven
in part by a flight to quality, particularly towards the end of the
year. In addition, we successfully managed through significant
storm activity, with catastrophe losses of $919 million after-tax
($1.408 billion pre-tax) for the year.
Our investment portfolio, our capital position and our liquidity
continue to be very strong, despite the significant disruption
in the financial markets. At year end, our operating company
capital remained at or above all of our target levels, our total
debt-to-capital ratio of 19.5 percent was below our 20.0 percent
target, and our holding company liquidity was $2.1 billion,
almost twice our target of one year’s worth of interest and
dividends. Finally, while a number of companies in the financial
services industry suffered ratings downgrades during 2008,
Moody’s upgraded our debt and insurance financial strength
ratings during the second quarter.
Moreover, our year-end book value per share* of $43.37
increased 5 percent from a year earlier, after giving effect
to more than $2.1 billion of common share repurchases and
$712 million of common stock dividends. We closed the year
with more than $25 billion of common equity.
*Ex FAS 115 (Excludes unrealized investment gains and losses, net of tax)