Travelers 2008 Annual Report Download - page 84
Download and view the complete annual report
Please find page 84 of the 2008 Travelers annual report below. You can navigate through the pages in the report by either clicking on the pages listed below, or by using the keyword search tool below to find specific information within the annual report.-
 1
1 -
2
-
3
-
4
-
5
-
6
-
7
-
8
-
9
-
10
-
11
-
12
-
13
-
14
-
15
-
16
-
17
-
18
-
19
-
20
-
21
-
22
-
23
-
24
-
25
-
26
-
27
-
28
-
29
-
30
-
31
-
32
-
33
-
34
-
35
-
36
-
37
-
38
-
39
-
40
-
41
-
42
-
43
-
44
-
45
-
46
-
47
-
48
-
49
-
50
-
51
-
52
-
53
-
54
-
55
-
56
-
57
-
58
-
59
-
60
-
61
-
62
-
63
-
64
-
65
-
66
-
67
-
68
-
69
-
70
-
71
-
72
-
73
-
 74
74 -
 75
75 -
 76
76 -
 77
77 -
 78
78 -
 79
79 -
 80
80 -
 81
81 -
 82
82 -
 83
83 -
 84
84 -
 85
85 -
 86
86 -
 87
87 -
 88
88 -
 89
89 -
 90
90 -
 91
91 -
 92
92 -
 93
93 -
 94
94 -
95
-
96
-
97
-
98
-
99
-
100
-
101
-
102
-
103
-
104
-
105
-
106
-
107
-
108
-
109
-
110
-
111
-
112
-
113
-
114
-
115
-
116
-
117
-
118
-
119
-
120
-
121
-
122
-
123
-
124
-
125
-
126
-
127
-
128
-
129
-
130
-
131
-
132
-
133
-
134
-
135
-
136
-
137
-
138
-
139
-
140
-
141
-
142
-
143
-
144
-
145
-
146
-
147
-
148
-
149
-
150
-
151
-
152
-
153
-
154
-
155
-
156
-
157
-
158
-
159
-
160
-
161
-
162
-
163
-
164
-
165
-
166
-
167
-
168
-
169
-
170
-
171
-
172
-
173
-
174
-
175
-
176
-
177
-
178
-
179
-
180
-
181
-
182
-
183
-
184
-
185
-
186
-
187
-
188
-
189
-
190
-
191
-
192
-
193
-
194
-
195
-
196
-
197
-
198
-
199
-
200
-
201
-
202
-
203
-
204
-
205
-
206
-
207
-
208
-
209
-
210
-
211
-
212
-
213
-
214
-
215
-
216
-
217
-
218
-
219
-
220
-
221
-
222
-
223
-
224
-
225
-
226
-
227
-
228
-
229
-
230
-
231
-
232
-
233
-
234
-
235
-
236
-
237
-
238
-
239
-
240
-
241
-
242
-
243
-
244
-
245
-
246
-
247
-
248
-
249
-
250
-
251
-
252
-
253
-
254
-
255
-
256
-
257
-
258
-
259
-
260
-
261
-
262
-
263
-
264
-
265
-
266
-
267
-
268
-
269
-
270
-
271
-
272
-
273
-
274
-
275
-
276
-
277
-
278
-
279
-
280
-
281
-
282
-
283
-
284
-
285
-
286
-
287
-
288
 |
 |

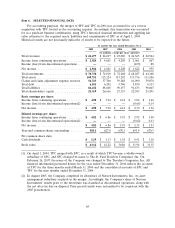
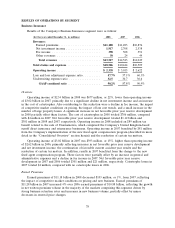
respectively, in 2006. Adjusting for the sales of these subsidiaries in both years, earned premiums in
2007 grew 4% over 2006. In the Business Insurance segment, earned premium growth of 4% in 2007
over 2006 primarily reflected the impact of the growth in business volume over the preceding twelve
months. In the Financial, Professional & International Insurance segment, earned premium growth of
4% in 2007 over 2006 (adjusted for the sale of Afianzadora Insurgentes) was driven by the favorable
impact of foreign currency rates of exchange, growth in business volume and a benefit from
adjustments to prior year premium estimates for the Company’s operations at Lloyd’s. In the Personal
Insurance segment, earned premium growth of 6% in 2007 over 2006 (adjusted for the sale of
Mendota) reflected continued strong business retention rates, continued renewal price increases and
growth from new business volumes over the preceding twelve months.
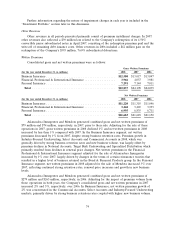
Net Investment Income
The following table sets forth information regarding the Company’s investments.
(for the year ended December 31, in millions) 2008 2007 2006
Average investments(a) ................................... $74,197 $73,872 $71,252
Pretax net investment income .............................. 2,792 3,761 3,517
After-tax net investment income ............................ 2,299 2,915 2,712
Average pretax yield(b) .................................. 3.8% 5.1% 4.9%
Average after-tax yield(b) ................................. 3.1% 3.9% 3.8%
(a) Excludes net unrealized investment gains and losses, net of tax, and is adjusted for cash,
receivables for investment sales, payables on investment purchases and accrued investment income.
(b) Excludes net realized gains and losses and unrealized investment gains and losses.
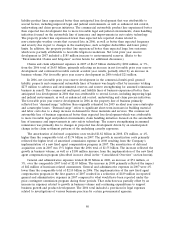
Net investment income of $2.79 billion in 2008 declined $969 million, or 26%, from 2007, primarily
due to lower returns from non-fixed maturity investments, which were negative in 2008, compared with
strong positive returns in 2007. Non-fixed maturity investments include private equity partnerships,
hedge funds and real estate partnerships that are accounted for under the equity method of accounting
and typically report financial statement information on a lag. These partnerships and funds produced
negative net investment income of $327 million in 2008 compared with net investment income of
$473 million in 2007. The value of many of these investments was updated through year-end based
upon information made available by certain of the investment managers. This update accounted for
$87 million of the non-fixed maturity portfolio’s investment loss described above. The decline in net
investment income from these investments in 2008 reflected market conditions, which resulted in a
lower level of transactions and lower market values compared to those at December 31, 2007. Net
investment income from the Company’s fixed maturity portfolio in 2008 also declined from 2007,
primarily due to a significant decline in short-term interest rates. The amortized cost of the fixed
maturity portfolio at December 31, 2008 totaled $61.57 billion, $2.58 billion lower than at the same
date in 2007, primarily reflecting the use of $2.12 billion of funds for the Company’s common share
repurchases during 2008, the payment of $715 million of dividends to shareholders, the transfer of
$662 million of fixed maturity investments as part of the sale of Unionamerica, and $450 million of
contributions to the Company’s pension plan, which were partially offset by strong cash flows from
operating activities. The average pretax investment yield of 3.8% in 2008 declined from 5.1% in 2007,
primarily reflecting the negative investment income from non-fixed maturity investments in 2008.
Net investment income totaled $3.76 billion in 2007, an increase of $244 million, or 7%, over 2006
net investment income of $3.52 billion. The increase in 2007 was primarily the result of continued
growth in the Company’s fixed maturity portfolio resulting from strong cash flows from operating
activities and higher yields on long-term taxable fixed maturity securities. Also contributing to
investment income growth in 2007 were strong levels of net investment income from the Company’s
72