Travelers 2008 Annual Report Download - page 100
Download and view the complete annual report
Please find page 100 of the 2008 Travelers annual report below. You can navigate through the pages in the report by either clicking on the pages listed below, or by using the keyword search tool below to find specific information within the annual report.-
 1
1 -
2
-
3
-
4
-
5
-
6
-
7
-
8
-
9
-
10
-
11
-
12
-
13
-
14
-
15
-
16
-
17
-
18
-
19
-
20
-
21
-
22
-
23
-
24
-
25
-
26
-
27
-
28
-
29
-
30
-
31
-
32
-
33
-
34
-
35
-
36
-
37
-
38
-
39
-
40
-
41
-
42
-
43
-
44
-
45
-
46
-
47
-
48
-
49
-
50
-
51
-
52
-
53
-
54
-
55
-
56
-
57
-
58
-
59
-
60
-
61
-
62
-
63
-
64
-
65
-
66
-
67
-
68
-
69
-
70
-
71
-
72
-
73
-
74
-
75
-
76
-
77
-
78
-
79
-
80
-
81
-
82
-
83
-
84
-
85
-
86
-
87
-
88
-
89
-
 90
90 -
 91
91 -
 92
92 -
 93
93 -
 94
94 -
 95
95 -
 96
96 -
 97
97 -
 98
98 -
 99
99 -
 100
100 -
 101
101 -
 102
102 -
 103
103 -
 104
104 -
 105
105 -
 106
106 -
 107
107 -
 108
108 -
 109
109 -
 110
110 -
111
-
112
-
113
-
114
-
115
-
116
-
117
-
118
-
119
-
120
-
121
-
122
-
123
-
124
-
125
-
126
-
127
-
128
-
129
-
130
-
131
-
132
-
133
-
134
-
135
-
136
-
137
-
138
-
139
-
140
-
141
-
142
-
143
-
144
-
145
-
146
-
147
-
148
-
149
-
150
-
151
-
152
-
153
-
154
-
155
-
156
-
157
-
158
-
159
-
160
-
161
-
162
-
163
-
164
-
165
-
166
-
167
-
168
-
169
-
170
-
171
-
172
-
173
-
174
-
175
-
176
-
177
-
178
-
179
-
180
-
181
-
182
-
183
-
184
-
185
-
186
-
187
-
188
-
189
-
190
-
191
-
192
-
193
-
194
-
195
-
196
-
197
-
198
-
199
-
200
-
201
-
202
-
203
-
204
-
205
-
206
-
207
-
208
-
209
-
210
-
211
-
212
-
213
-
214
-
215
-
216
-
217
-
218
-
219
-
220
-
221
-
222
-
223
-
224
-
225
-
226
-
227
-
228
-
229
-
230
-
231
-
232
-
233
-
234
-
235
-
236
-
237
-
238
-
239
-
240
-
241
-
242
-
243
-
244
-
245
-
246
-
247
-
248
-
249
-
250
-
251
-
252
-
253
-
254
-
255
-
256
-
257
-
258
-
259
-
260
-
261
-
262
-
263
-
264
-
265
-
266
-
267
-
268
-
269
-
270
-
271
-
272
-
273
-
274
-
275
-
276
-
277
-
278
-
279
-
280
-
281
-
282
-
283
-
284
-
285
-
286
-
287
-
288
 |
 |
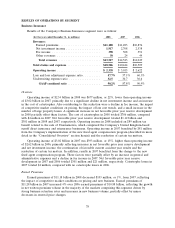
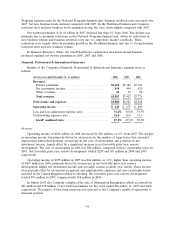
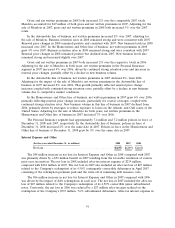
with $163 million in 2007. Net favorable prior year reserve development in 2008 and 2007 totaled
$143 million and $152 million, respectively. In addition, results in 2007 benefited by $71 million from
the Company’s implementation of a new fixed agent compensation program, which is described in more
detail in the ‘‘Consolidated Overview’’ section herein.
Operating income of $1.02 billion in 2007 was $113 million, or 10%, lower than operating income
of $1.13 billion in 2006, primarily reflecting a decline in net favorable prior year reserve development
and an increase in catastrophe losses, partially offset by growth in business volume and net investment
income and the $71 million benefit from the new fixed agent compensation program. Net favorable
prior year reserve development in 2007 and 2006 totaled $152 million and $359 million, respectively.
Catastrophe losses in 2007 totaled $163 million, compared with catastrophe losses of $103 million in
2006.
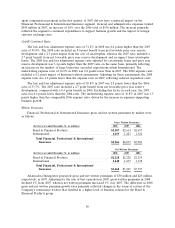
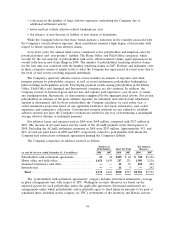
In April 2007, the Company completed the sale of its subsidiary, Mendota Insurance Company,
and its wholly-owned subsidiaries, Mendakota Insurance Company and Mendota Insurance Agency, Inc.
(collectively, Mendota). These subsidiaries primarily offered nonstandard automobile coverage and
accounted for $49 million and $187 million of net written premiums in the years ended December 31,
2007 and 2006, respectively. The impact of this transaction was not material to the Company’s results
of operations or financial position.
Earned Premiums
Earned premiums of $6.97 billion in 2008 increased $167 million, or 2%, over earned premiums of
$6.80 billion in 2007. Adjusting for the sale of Mendota in 2007, earned premiums in 2008 increased
3% over 2007. The increase reflected continued strong business retention rates and new business
volume, coupled with continued renewal price increases. Earned premiums of $6.80 billion in 2007 grew
4% over 2006, primarily reflecting continued strong business retention rates, increases in renewal price
changes, and growth from new business volume, partially offset by the impact of the sale of Mendota in
early April 2007. Adjusting for the impact of Mendota in both years, earned premiums in 2007
increased 6% over 2006.
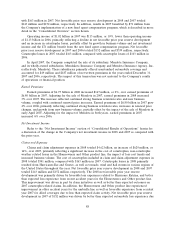
Net Investment Income
Refer to the ‘‘Net Investment Income’’ section of ‘‘Consolidated Results of Operations’’ herein for
a discussion of the change in the Company’s net investment income in 2008 and 2007 as compared with
the prior year.
Claims and Expenses
Claims and claim adjustment expenses in 2008 totaled $4.62 billion, an increase of $629 million, or
16%, over 2007, primarily reflecting a significant increase in the cost of catastrophes, non-catastrophe
weather related losses in the Homeowners and Other product line, the impact of loss cost trends and
increased business volume. The cost of catastrophes included in claim and claim adjustment expenses in
2008 totaled $541 million, compared with $163 million in 2007. Catastrophe losses in 2008 primarily
resulted from Hurricanes Ike and Gustav, as well as tornado, wind and hail storms in various regions of
the United States throughout the year. Net favorable prior year reserve development in 2008 and 2007
totaled $143 million and $152 million, respectively. The 2008 net favorable prior year reserve
development was primarily driven by favorable loss experience related to Hurricane Katrina, and better
than expected loss experience from recent accident years for the Homeowners and Other product line.
This improvement was driven in part by claim initiatives as well as better than expected outcomes on
2007 catastrophe-related claims. In addition, the Homeowners and Other product line experienced
improvement in older accident years for the umbrella line as well as favorable experience from accident
year 2007 for allied coverages due to less than expected claim activity. Net favorable prior year reserve
development in 2007 of $152 million was driven by better than expected automobile loss experience due
88