Travelers 2008 Annual Report Download - page 82
Download and view the complete annual report
Please find page 82 of the 2008 Travelers annual report below. You can navigate through the pages in the report by either clicking on the pages listed below, or by using the keyword search tool below to find specific information within the annual report.-
 1
1 -
2
-
3
-
4
-
5
-
6
-
7
-
8
-
9
-
10
-
11
-
12
-
13
-
14
-
15
-
16
-
17
-
18
-
19
-
20
-
21
-
22
-
23
-
24
-
25
-
26
-
27
-
28
-
29
-
30
-
31
-
32
-
33
-
34
-
35
-
36
-
37
-
38
-
39
-
40
-
41
-
42
-
43
-
44
-
45
-
46
-
47
-
48
-
49
-
50
-
51
-
52
-
53
-
54
-
55
-
56
-
57
-
58
-
59
-
60
-
61
-
62
-
63
-
64
-
65
-
66
-
67
-
68
-
69
-
70
-
71
-
 72
72 -
 73
73 -
 74
74 -
 75
75 -
 76
76 -
 77
77 -
 78
78 -
 79
79 -
 80
80 -
 81
81 -
 82
82 -
 83
83 -
 84
84 -
 85
85 -
 86
86 -
 87
87 -
 88
88 -
 89
89 -
 90
90 -
 91
91 -
 92
92 -
93
-
94
-
95
-
96
-
97
-
98
-
99
-
100
-
101
-
102
-
103
-
104
-
105
-
106
-
107
-
108
-
109
-
110
-
111
-
112
-
113
-
114
-
115
-
116
-
117
-
118
-
119
-
120
-
121
-
122
-
123
-
124
-
125
-
126
-
127
-
128
-
129
-
130
-
131
-
132
-
133
-
134
-
135
-
136
-
137
-
138
-
139
-
140
-
141
-
142
-
143
-
144
-
145
-
146
-
147
-
148
-
149
-
150
-
151
-
152
-
153
-
154
-
155
-
156
-
157
-
158
-
159
-
160
-
161
-
162
-
163
-
164
-
165
-
166
-
167
-
168
-
169
-
170
-
171
-
172
-
173
-
174
-
175
-
176
-
177
-
178
-
179
-
180
-
181
-
182
-
183
-
184
-
185
-
186
-
187
-
188
-
189
-
190
-
191
-
192
-
193
-
194
-
195
-
196
-
197
-
198
-
199
-
200
-
201
-
202
-
203
-
204
-
205
-
206
-
207
-
208
-
209
-
210
-
211
-
212
-
213
-
214
-
215
-
216
-
217
-
218
-
219
-
220
-
221
-
222
-
223
-
224
-
225
-
226
-
227
-
228
-
229
-
230
-
231
-
232
-
233
-
234
-
235
-
236
-
237
-
238
-
239
-
240
-
241
-
242
-
243
-
244
-
245
-
246
-
247
-
248
-
249
-
250
-
251
-
252
-
253
-
254
-
255
-
256
-
257
-
258
-
259
-
260
-
261
-
262
-
263
-
264
-
265
-
266
-
267
-
268
-
269
-
270
-
271
-
272
-
273
-
274
-
275
-
276
-
277
-
278
-
279
-
280
-
281
-
282
-
283
-
284
-
285
-
286
-
287
-
288
 |
 |

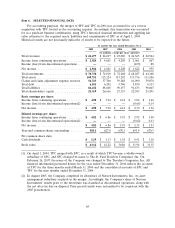
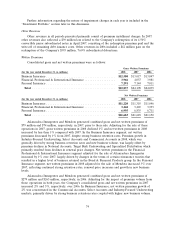
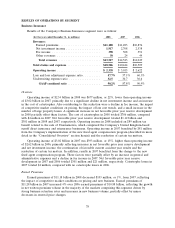
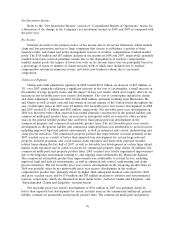
Consolidated Results of Operations
(for the year ended December 31, in millions except per share amounts) 2008 2007 2006
Revenues
Premiums .............................................. $21,579 $21,470 $20,760
Net investment income ..................................... 2,792 3,761 3,517
Fee income ............................................. 390 508 591
Net realized investment gains (losses) .......................... (415) 154 11
Other revenues .......................................... 131 124 211
Total revenues ........................................ 24,477 26,017 25,090
Claims and expenses
Claims and claim adjustment expenses .......................... 12,993 12,397 12,244
Amortization of deferred acquisition costs ....................... 3,880 3,706 3,339
General and administrative expenses ........................... 3,518 3,352 3,458
Interest expense .......................................... 370 346 324
Total claims and expenses ............................... 20,761 19,801 19,365
Income before income taxes ................................ 3,716 6,216 5,725
Income tax expense ....................................... 792 1,615 1,517
Net income ............................................ $ 2,924 $ 4,601 $ 4,208
Net income per share
Basic ................................................ $ 4.90 $ 7.04 $ 6.12
Diluted .............................................. $ 4.82 $ 6.86 $ 5.91
GAAP combined ratio
Loss and loss adjustment expense ratio ....................... 59.4% 56.6% 57.5%
Underwriting expense ratio ................................ 32.5 30.8 30.6
GAAP combined ratio .................................. 91.9% 87.4% 88.1%
The Company’s discussions of net income and segment operating income included in the following
discussion are presented on an after-tax basis. Discussions of the components of net income and
segment operating income are presented on a pretax basis, unless otherwise noted. Discussions of
earnings per common share are presented on a diluted basis.
Overview
Net income of $4.82 per common share in 2008 was 30% lower than the $6.86 per common share
in 2007. Net income in 2008 totaled $2.92 billion, 36% lower than $4.60 billion in 2007. The lower rate
of decline in per share income compared with the rate of decline in actual income reflected the impact
of the Company’s significant common share repurchases. The decrease in net income in 2008 was
primarily due to a significant increase in the cost of catastrophes and a significant decline in net
investment income. Also contributing to the decline were net realized investment losses, a small
increase in the number of large losses that exceeded expectations, an increase in non-catastrophe
related weather losses, the impact of competitive market conditions on pricing, the impact of loss cost
trends and a decline in fee income. Net income in 2008 reflected an $89 million tax benefit related to
the sale of a subsidiary. In 2007, net income included a net pretax benefit of $163 million due to the
implementation of a new fixed, value-based compensation program for the majority of the Company’s
agents which resulted in a reduction in commission expense compared to what would have otherwise
been reported, due to a change in the timing of expense recognition. These factors were partially offset
by an increase in net favorable prior year reserve development, which totaled $1.54 billion in 2008,
70