Travelers 2008 Annual Report Download - page 101
Download and view the complete annual report
Please find page 101 of the 2008 Travelers annual report below. You can navigate through the pages in the report by either clicking on the pages listed below, or by using the keyword search tool below to find specific information within the annual report.-
 1
1 -
2
-
3
-
4
-
5
-
6
-
7
-
8
-
9
-
10
-
11
-
12
-
13
-
14
-
15
-
16
-
17
-
18
-
19
-
20
-
21
-
22
-
23
-
24
-
25
-
26
-
27
-
28
-
29
-
30
-
31
-
32
-
33
-
34
-
35
-
36
-
37
-
38
-
39
-
40
-
41
-
42
-
43
-
44
-
45
-
46
-
47
-
48
-
49
-
50
-
51
-
52
-
53
-
54
-
55
-
56
-
57
-
58
-
59
-
60
-
61
-
62
-
63
-
64
-
65
-
66
-
67
-
68
-
69
-
70
-
71
-
72
-
73
-
74
-
75
-
76
-
77
-
78
-
79
-
80
-
81
-
82
-
83
-
84
-
85
-
86
-
87
-
88
-
89
-
90
-
 91
91 -
 92
92 -
 93
93 -
 94
94 -
 95
95 -
 96
96 -
 97
97 -
 98
98 -
 99
99 -
 100
100 -
 101
101 -
 102
102 -
 103
103 -
 104
104 -
 105
105 -
 106
106 -
 107
107 -
 108
108 -
 109
109 -
 110
110 -
 111
111 -
112
-
113
-
114
-
115
-
116
-
117
-
118
-
119
-
120
-
121
-
122
-
123
-
124
-
125
-
126
-
127
-
128
-
129
-
130
-
131
-
132
-
133
-
134
-
135
-
136
-
137
-
138
-
139
-
140
-
141
-
142
-
143
-
144
-
145
-
146
-
147
-
148
-
149
-
150
-
151
-
152
-
153
-
154
-
155
-
156
-
157
-
158
-
159
-
160
-
161
-
162
-
163
-
164
-
165
-
166
-
167
-
168
-
169
-
170
-
171
-
172
-
173
-
174
-
175
-
176
-
177
-
178
-
179
-
180
-
181
-
182
-
183
-
184
-
185
-
186
-
187
-
188
-
189
-
190
-
191
-
192
-
193
-
194
-
195
-
196
-
197
-
198
-
199
-
200
-
201
-
202
-
203
-
204
-
205
-
206
-
207
-
208
-
209
-
210
-
211
-
212
-
213
-
214
-
215
-
216
-
217
-
218
-
219
-
220
-
221
-
222
-
223
-
224
-
225
-
226
-
227
-
228
-
229
-
230
-
231
-
232
-
233
-
234
-
235
-
236
-
237
-
238
-
239
-
240
-
241
-
242
-
243
-
244
-
245
-
246
-
247
-
248
-
249
-
250
-
251
-
252
-
253
-
254
-
255
-
256
-
257
-
258
-
259
-
260
-
261
-
262
-
263
-
264
-
265
-
266
-
267
-
268
-
269
-
270
-
271
-
272
-
273
-
274
-
275
-
276
-
277
-
278
-
279
-
280
-
281
-
282
-
283
-
284
-
285
-
286
-
287
-
288
 |
 |
in part to claim initiatives and fewer than expected late reported homeowners’ claims related to
non-catastrophe weather events that occurred in the fourth quarter of 2006. In addition, a portion of
net favorable prior year reserve development in the Homeowners and Other line of business in 2007
was attributable to a decrease in the number of claims due to changes in the marketplace, including
higher deductibles and fewer small-dollar claims.
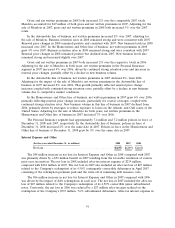
Claims and claim adjustment expenses in 2007 totaled $3.99 billion, an increase of $390 million, or
11%, over 2006, primarily reflecting a decline in net favorable prior year reserve development, an
increase in catastrophe losses and higher business volume, partially offset by the impact of the sale of
Mendota.
Net favorable prior year reserve development of $359 million in 2006 was driven by better than
expected loss experience in the auto bodily injury and non-catastrophe related Homeowners and Other
lines of business, and a reduction in loss estimates for the 2005 hurricanes. In the Automobile line of
business, the improvement in 2006 was partially driven by better than expected results from changes in
claim handling practices. These changes included practices which have allowed case reserves to be
established more accurately earlier in the claim settlement process, thereby changing historical loss
development patterns. In addition, industry and Company initiatives to fight fraud in several states led
to a decrease in the total number of claims and a change in historical loss development patterns. In the
Homeowners and Other line of business, favorable prior year reserve development in 2006 was partially
driven by a significant decrease in the number of claims, attributable to changes in the marketplace,
including higher deductibles and fewer small-dollar claims. These changes also resulted in a change in
historical loss development patterns. In addition, for 2006, non-catastrophe related Homeowners and
Other loss experience was favorable due to continued evidence of a less than expected impact from
‘‘demand surge,’’ which refers to significant short-term increases in building material and labor costs
due to a sharp increase in demand for those materials and services. Approximately $100 million of net
favorable prior year reserve development in 2006 resulted from a reduction in loss estimates for
catastrophes incurred in 2005, primarily due to lower than expected additional living expense losses
related to Hurricane Katrina.
Catastrophe losses in 2007 totaled $163 million, $60 million higher than the 2006 total of
$103 million. Catastrophe losses in 2007 were primarily the result of wildfires in California and several
storms throughout the United States, whereas the 2006 total was driven by several wind, rain, hail and
snow storms throughout the year in the United States.
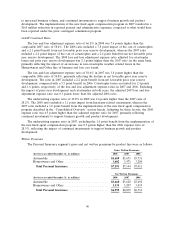
The amortization of deferred acquisition costs totaled $1.41 billion in 2008, compared with
$1.31 billion in 2007. The growth in amortization costs in 2008 primarily reflected the higher level of
amortized commission expense in 2008 resulting from the Company’s implementation of a new fixed
agent compensation program in 2007, as well as an increase in business volume.
The amortization of deferred acquisition costs totaled $1.31 billion in 2007, $156 million, or 14%,
higher than the comparable 2006 total of $1.15 billion. The increase included $94 million from the
implementation of the new fixed agent compensation program in 2007 described in more detail in the
‘‘Consolidated Overview’’ section herein, as well as growth in business volume, partially offset by the
impact of the sale of Mendota.
General and administrative expenses totaled $829 million in 2008, an increase of $130 million, or
19% over the 2007 total of $699 million. The increase in 2008 included the impact of $77 million of
hurricane-related assessments. The remaining increase reflected growth in business volume and
continued investments to support business growth and product development.
General and administrative expenses totaled $699 million in 2007, a decrease of $105 million, or
13%, from the 2006 total of $804 million. The decrease in expenses in 2007 primarily reflected a
decline in commission expenses resulting from the implementation of the new fixed agent compensation
program, as well as the impact of the sale of Mendota, which were partially offset by expenses related
89