Travelers 2008 Annual Report Download - page 80
Download and view the complete annual report
Please find page 80 of the 2008 Travelers annual report below. You can navigate through the pages in the report by either clicking on the pages listed below, or by using the keyword search tool below to find specific information within the annual report.-
 1
1 -
2
-
3
-
4
-
5
-
6
-
7
-
8
-
9
-
10
-
11
-
12
-
13
-
14
-
15
-
16
-
17
-
18
-
19
-
20
-
21
-
22
-
23
-
24
-
25
-
26
-
27
-
28
-
29
-
30
-
31
-
32
-
33
-
34
-
35
-
36
-
37
-
38
-
39
-
40
-
41
-
42
-
43
-
44
-
45
-
46
-
47
-
48
-
49
-
50
-
51
-
52
-
53
-
54
-
55
-
56
-
57
-
58
-
59
-
60
-
61
-
62
-
63
-
64
-
65
-
66
-
67
-
68
-
69
-
 70
70 -
 71
71 -
 72
72 -
 73
73 -
 74
74 -
 75
75 -
 76
76 -
 77
77 -
 78
78 -
 79
79 -
 80
80 -
 81
81 -
 82
82 -
 83
83 -
 84
84 -
 85
85 -
 86
86 -
 87
87 -
 88
88 -
 89
89 -
 90
90 -
91
-
92
-
93
-
94
-
95
-
96
-
97
-
98
-
99
-
100
-
101
-
102
-
103
-
104
-
105
-
106
-
107
-
108
-
109
-
110
-
111
-
112
-
113
-
114
-
115
-
116
-
117
-
118
-
119
-
120
-
121
-
122
-
123
-
124
-
125
-
126
-
127
-
128
-
129
-
130
-
131
-
132
-
133
-
134
-
135
-
136
-
137
-
138
-
139
-
140
-
141
-
142
-
143
-
144
-
145
-
146
-
147
-
148
-
149
-
150
-
151
-
152
-
153
-
154
-
155
-
156
-
157
-
158
-
159
-
160
-
161
-
162
-
163
-
164
-
165
-
166
-
167
-
168
-
169
-
170
-
171
-
172
-
173
-
174
-
175
-
176
-
177
-
178
-
179
-
180
-
181
-
182
-
183
-
184
-
185
-
186
-
187
-
188
-
189
-
190
-
191
-
192
-
193
-
194
-
195
-
196
-
197
-
198
-
199
-
200
-
201
-
202
-
203
-
204
-
205
-
206
-
207
-
208
-
209
-
210
-
211
-
212
-
213
-
214
-
215
-
216
-
217
-
218
-
219
-
220
-
221
-
222
-
223
-
224
-
225
-
226
-
227
-
228
-
229
-
230
-
231
-
232
-
233
-
234
-
235
-
236
-
237
-
238
-
239
-
240
-
241
-
242
-
243
-
244
-
245
-
246
-
247
-
248
-
249
-
250
-
251
-
252
-
253
-
254
-
255
-
256
-
257
-
258
-
259
-
260
-
261
-
262
-
263
-
264
-
265
-
266
-
267
-
268
-
269
-
270
-
271
-
272
-
273
-
274
-
275
-
276
-
277
-
278
-
279
-
280
-
281
-
282
-
283
-
284
-
285
-
286
-
287
-
288
 |
 |

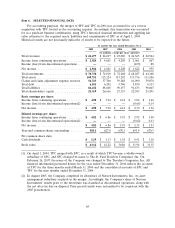
Item 6. SELECTED FINANCIAL DATA
For accounting purposes, the merger of SPC and TPC in 2004 was accounted for as a reverse
acquisition with TPC treated as the accounting acquirer. Accordingly, this transaction was accounted
for as a purchase business combination, using TPC’s historical financial information and applying fair
value estimates to the acquired assets, liabilities and commitments of SPC as of April 1, 2004.
Historical results are not necessarily indicative of results to be expected in the future.
At and for the year ended December 31,(1)
2008 2007 2006 2005 2004
(in millions, except per share amounts)
Total revenues ........................ $ 24,477 $ 26,017 $ 25,090 $ 24,365 $ 22,544
Income from continuing operations ......... $ 2,924 $ 4,601 $ 4,208 $ 2,061 $ 867
Income (loss) from discontinued operations . . . —— — (439) 88
Net income .......................... $ 2,924 $ 4,601 $ 4,208 $ 1,622 $ 955
Total investments ...................... $ 70,738 $ 74,818 $ 72,268 $ 68,287 $ 64,368
Total assets .......................... 109,751 115,224 115,292 113,736 111,246
Claims and claim adjustment expense reserves . 54,723 57,700 59,288 61,090 59,070
Total debt ........................... 6,181 6,242 5,760 5,850 6,313
Total liabilities ........................ 84,432 88,608 90,157 91,433 90,045
Total shareholders’ equity ................ 25,319 26,616 25,135 22,303 21,201
Basic earnings per share:
Income from continuing operations ......... $ 4.90 $ 7.04 $ 6.12 $ 3.04 $ 1.42
Income (loss) from discontinued operations(2) . —— — (0.65) 0.14
Net income .......................... $ 4.90 $ 7.04 $ 6.12 $ 2.39 $ 1.56
Diluted earnings per share:
Income from continuing operations ......... $ 4.82 $ 6.86 $ 5.91 $ 2.95 $ 1.40
Income (loss) from discontinued operations(2) . —— — (0.62) 0.13
Net income .......................... $ 4.82 $ 6.86 $ 5.91 $ 2.33 $ 1.53
Year-end common shares outstanding ....... 585.1 627.8 678.3 693.4 670.3
Per common share data:
Cash dividends ........................ $ 1.19 $ 1.13 $ 1.01 $ 0.91 $ 1.16
Book value .......................... $ 43.12 $ 42.22 $ 36.86 $ 31.94 $ 31.35
(1) On April 1, 2004, TPC merged with SPC, as a result of which TPC became a wholly-owned
subsidiary of SPC, and SPC changed its name to The St. Paul Travelers Companies, Inc. On
February 26, 2007, the name of the Company was changed to The Travelers Companies, Inc. All
financial information presented herein for the year ended December 31, 2004 reflects the accounts
of TPC for the three months ended March 31, 2004 and the consolidated accounts of SPC and
TPC for the nine months ended December 31, 2004.
(2) In August 2005, the Company completed its divestiture of Nuveen Investments, Inc., its asset
management subsidiary acquired in the merger. Accordingly, the Company’s share of Nuveen
Investments’ results prior to the divestiture was classified as discontinued operations, along with
the net after-tax loss on disposal. Prior period results were reclassified to be consistent with the
2005 presentation.
68