Travelers 2008 Annual Report Download - page 119
Download and view the complete annual report
Please find page 119 of the 2008 Travelers annual report below. You can navigate through the pages in the report by either clicking on the pages listed below, or by using the keyword search tool below to find specific information within the annual report.-
 1
1 -
2
-
3
-
4
-
5
-
6
-
7
-
8
-
9
-
10
-
11
-
12
-
13
-
14
-
15
-
16
-
17
-
18
-
19
-
20
-
21
-
22
-
23
-
24
-
25
-
26
-
27
-
28
-
29
-
30
-
31
-
32
-
33
-
34
-
35
-
36
-
37
-
38
-
39
-
40
-
41
-
42
-
43
-
44
-
45
-
46
-
47
-
48
-
49
-
50
-
51
-
52
-
53
-
54
-
55
-
56
-
57
-
58
-
59
-
60
-
61
-
62
-
63
-
64
-
65
-
66
-
67
-
68
-
69
-
70
-
71
-
72
-
73
-
74
-
75
-
76
-
77
-
78
-
79
-
80
-
81
-
82
-
83
-
84
-
85
-
86
-
87
-
88
-
89
-
90
-
91
-
92
-
93
-
94
-
95
-
96
-
97
-
98
-
99
-
100
-
101
-
102
-
103
-
104
-
105
-
106
-
107
-
108
-
 109
109 -
 110
110 -
 111
111 -
 112
112 -
 113
113 -
 114
114 -
 115
115 -
 116
116 -
 117
117 -
 118
118 -
 119
119 -
 120
120 -
 121
121 -
 122
122 -
 123
123 -
 124
124 -
 125
125 -
 126
126 -
 127
127 -
 128
128 -
 129
129 -
130
-
131
-
132
-
133
-
134
-
135
-
136
-
137
-
138
-
139
-
140
-
141
-
142
-
143
-
144
-
145
-
146
-
147
-
148
-
149
-
150
-
151
-
152
-
153
-
154
-
155
-
156
-
157
-
158
-
159
-
160
-
161
-
162
-
163
-
164
-
165
-
166
-
167
-
168
-
169
-
170
-
171
-
172
-
173
-
174
-
175
-
176
-
177
-
178
-
179
-
180
-
181
-
182
-
183
-
184
-
185
-
186
-
187
-
188
-
189
-
190
-
191
-
192
-
193
-
194
-
195
-
196
-
197
-
198
-
199
-
200
-
201
-
202
-
203
-
204
-
205
-
206
-
207
-
208
-
209
-
210
-
211
-
212
-
213
-
214
-
215
-
216
-
217
-
218
-
219
-
220
-
221
-
222
-
223
-
224
-
225
-
226
-
227
-
228
-
229
-
230
-
231
-
232
-
233
-
234
-
235
-
236
-
237
-
238
-
239
-
240
-
241
-
242
-
243
-
244
-
245
-
246
-
247
-
248
-
249
-
250
-
251
-
252
-
253
-
254
-
255
-
256
-
257
-
258
-
259
-
260
-
261
-
262
-
263
-
264
-
265
-
266
-
267
-
268
-
269
-
270
-
271
-
272
-
273
-
274
-
275
-
276
-
277
-
278
-
279
-
280
-
281
-
282
-
283
-
284
-
285
-
286
-
287
-
288
 |
 |

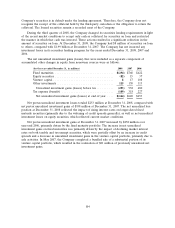
$258 million. These securities in an unrealized loss position represented approximately 2% of both the
total amortized cost and the fair value of the fixed maturity portfolio at December 31, 2008. These
securities accounted for 15% of the total pretax unrealized investment loss in the fixed maturity
portfolio at December 31, 2008.
Following are the pretax realized losses on investments sold during the year ended December 31,
2008:
(in millions) Loss Fair Value
Fixed maturities ..................................... $168 $2,735
Equity securities ..................................... 417
Total .............................................. $172 $2,752
Purchases and sales of investments are based on cash requirements, the characteristics of the
insurance liabilities and current market conditions. The Company identifies investments to be sold to
achieve its primary investment goals of assuring the Company’s ability to meet policyholder obligations
as well as to optimize investment returns, given these obligations.
CATASTROPHE MODELING
The Company uses various analyses and methods, including computer modeling techniques, to
analyze catastrophic events and the risks associated with them. The Company uses these analyses and
methods to make underwriting and reinsurance decisions designed to manage its exposure to
catastrophic events.
In making underwriting and reinsurance decisions, for hurricane and earthquake exposures, the
Company uses third-party proprietary computer modeling in an attempt to estimate the likelihood that
the loss from a single event occurring in a one-year timeframe will equal or exceed a particular
amount. The tables below set forth the estimated probabilities that losses from a single event occurring
in a one-year timeframe will equal or exceed the indicated loss amounts (expressed in dollars and as a
percentage of the Company’s common equity). For example, on the basis described below the tables,
the Company estimates that there is a one percent chance that the Company’s loss from a single U.S.
hurricane occurring in a one-year timeframe would equal or exceed $1.3 billion, or 5 percent of the
Company’s common equity at December 31, 2008.
Dollars (in billions)
Single Single
Likelihood of Exceedance(1) Hurricane Earthquake
2.0% (1-in-50) ................................... $1.1 $0.4
1.0% (1-in-100) .................................. $1.3 $0.6
0.4% (1-in-250) .................................. $2.1 $0.9
0.1% (1-in-1,000) ................................. $4.8 $2.1
107