Travelers 2008 Annual Report Download - page 3
Download and view the complete annual report
Please find page 3 of the 2008 Travelers annual report below. You can navigate through the pages in the report by either clicking on the pages listed below, or by using the keyword search tool below to find specific information within the annual report.-
 1
1 -
 2
2 -
 3
3 -
 4
4 -
 5
5 -
 6
6 -
 7
7 -
 8
8 -
 9
9 -
 10
10 -
 11
11 -
 12
12 -
 13
13 -
 14
14 -
15
-
16
-
17
-
18
-
19
-
20
-
21
-
22
-
23
-
24
-
25
-
26
-
27
-
28
-
29
-
30
-
31
-
32
-
33
-
34
-
35
-
36
-
37
-
38
-
39
-
40
-
41
-
42
-
43
-
44
-
45
-
46
-
47
-
48
-
49
-
50
-
51
-
52
-
53
-
54
-
55
-
56
-
57
-
58
-
59
-
60
-
61
-
62
-
63
-
64
-
65
-
66
-
67
-
68
-
69
-
70
-
71
-
72
-
73
-
74
-
75
-
76
-
77
-
78
-
79
-
80
-
81
-
82
-
83
-
84
-
85
-
86
-
87
-
88
-
89
-
90
-
91
-
92
-
93
-
94
-
95
-
96
-
97
-
98
-
99
-
100
-
101
-
102
-
103
-
104
-
105
-
106
-
107
-
108
-
109
-
110
-
111
-
112
-
113
-
114
-
115
-
116
-
117
-
118
-
119
-
120
-
121
-
122
-
123
-
124
-
125
-
126
-
127
-
128
-
129
-
130
-
131
-
132
-
133
-
134
-
135
-
136
-
137
-
138
-
139
-
140
-
141
-
142
-
143
-
144
-
145
-
146
-
147
-
148
-
149
-
150
-
151
-
152
-
153
-
154
-
155
-
156
-
157
-
158
-
159
-
160
-
161
-
162
-
163
-
164
-
165
-
166
-
167
-
168
-
169
-
170
-
171
-
172
-
173
-
174
-
175
-
176
-
177
-
178
-
179
-
180
-
181
-
182
-
183
-
184
-
185
-
186
-
187
-
188
-
189
-
190
-
191
-
192
-
193
-
194
-
195
-
196
-
197
-
198
-
199
-
200
-
201
-
202
-
203
-
204
-
205
-
206
-
207
-
208
-
209
-
210
-
211
-
212
-
213
-
214
-
215
-
216
-
217
-
218
-
219
-
220
-
221
-
222
-
223
-
224
-
225
-
226
-
227
-
228
-
229
-
230
-
231
-
232
-
233
-
234
-
235
-
236
-
237
-
238
-
239
-
240
-
241
-
242
-
243
-
244
-
245
-
246
-
247
-
248
-
249
-
250
-
251
-
252
-
253
-
254
-
255
-
256
-
257
-
258
-
259
-
260
-
261
-
262
-
263
-
264
-
265
-
266
-
267
-
268
-
269
-
270
-
271
-
272
-
273
-
274
-
275
-
276
-
277
-
278
-
279
-
280
-
281
-
282
-
283
-
284
-
285
-
286
-
287
-
288
 |
 |

1
We are extremely proud of what we were able to accomplish
despite the significant disruption in the financial markets
and the economic weakness experienced during 2008. We
believe that our achievements in 2008 position us well for
2009 and beyond.
Why did Travelers perform so well in 2008?
Our strong 2008 performance resulted from the successful
execution of our long-term strategy over several years. In par-
ticular, to achieve our goal of an operating return on equity in
the mid-teens over time, we concentrated, and will continue
to focus, on a few key operating principles, including:
Evaluation of risk and return — In last year’s shareholder
letter and many times before and since, we have said that
our fundamental business is one of managing the balance
between risk and reward, both on the liability side and on
the asset side of our balance sheet. This philosophy has
become part of our company’s core culture and differenti-
ates us from many of our competitors. Because it is tied to
our history, culture and experience, it is not easily copied.
Whether it involves a decision to underwrite a particular risk
or to make a specific investment, we carefully assess the
extent to which we are being adequately compensated for
the risk we are taking.
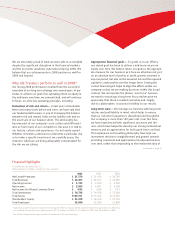
Appropriate financial goals — To guide us in our efforts,
our stated goal has been to deliver a mid-teens return on
equity over time. We believe return on equity is the appropri-
ate measure for our business as it focuses attention not just
on an absolute level of profits or profit growth achieved in
any one period, but also on the assumed risk and the required
capital to create profits over the longer term. Setting the
correct financial goal helps to align the efforts within our
company so that we are making decisions within this broad
context. We incorporate the phrase “over time” because
we want to encourage a long-term focus and because we
appreciate that there is market cyclicality and, largely
due to catastrophes, occasional volatility to our results.
Long-term view — We manage our business with long-term
returns and profitability in mind, which helps to ensure
that our risk-return equation is disciplined and thoughtful.
Our company is more than 150 years old. Over this time,
we have experienced both significant successes and fail-
ures, which have helped to develop our strong institutional
memory and an appreciation for both good times and bad.
This experience and resulting philosophy have kept our
investment decisions straightforward and geared towards
providing consistent and appropriate risk-adjusted returns
over time, rather than responding to the investment idea of
1Operating income equals net income excluding the after-tax impact of net realized investment gains (losses). After-tax
net realized investment gains (losses) were $(271) million in 2008, $101 million in 2007 and $8 million in 2006.
2Per diluted weighted average number of common shares outstanding.
Financial Highlights
At and for the year ended Dec. 31,
Dollar amounts in millions, except per share amounts.
2008 2007 2006
Net Earned Premiums $ 21,579 $ 21,470 $ 20,760
Total Revenues $ 24,477 $ 26,017 $ 25,090
Operating Income1$ 3,195 $ 4,500 $ 4,200
Net Income $ 2,924 $ 4,601 $ 4,208
Net Income Per Diluted Common Share2$ 4.82 $ 6.86 $ 5.91
Total Investments $ 70,738 $ 74,818 $ 72,268
Total Assets $109,751 $115,224 $115,292
Shareholders’ Equity $ 25,319 $ 26,616 $ 25,135
Total Employees 33,000 33,300 32,800
(continued on page 2)