Travelers 2008 Annual Report Download - page 85
Download and view the complete annual report
Please find page 85 of the 2008 Travelers annual report below. You can navigate through the pages in the report by either clicking on the pages listed below, or by using the keyword search tool below to find specific information within the annual report.-
 1
1 -
2
-
3
-
4
-
5
-
6
-
7
-
8
-
9
-
10
-
11
-
12
-
13
-
14
-
15
-
16
-
17
-
18
-
19
-
20
-
21
-
22
-
23
-
24
-
25
-
26
-
27
-
28
-
29
-
30
-
31
-
32
-
33
-
34
-
35
-
36
-
37
-
38
-
39
-
40
-
41
-
42
-
43
-
44
-
45
-
46
-
47
-
48
-
49
-
50
-
51
-
52
-
53
-
54
-
55
-
56
-
57
-
58
-
59
-
60
-
61
-
62
-
63
-
64
-
65
-
66
-
67
-
68
-
69
-
70
-
71
-
72
-
73
-
74
-
 75
75 -
 76
76 -
 77
77 -
 78
78 -
 79
79 -
 80
80 -
 81
81 -
 82
82 -
 83
83 -
 84
84 -
 85
85 -
 86
86 -
 87
87 -
 88
88 -
 89
89 -
 90
90 -
 91
91 -
 92
92 -
 93
93 -
 94
94 -
 95
95 -
96
-
97
-
98
-
99
-
100
-
101
-
102
-
103
-
104
-
105
-
106
-
107
-
108
-
109
-
110
-
111
-
112
-
113
-
114
-
115
-
116
-
117
-
118
-
119
-
120
-
121
-
122
-
123
-
124
-
125
-
126
-
127
-
128
-
129
-
130
-
131
-
132
-
133
-
134
-
135
-
136
-
137
-
138
-
139
-
140
-
141
-
142
-
143
-
144
-
145
-
146
-
147
-
148
-
149
-
150
-
151
-
152
-
153
-
154
-
155
-
156
-
157
-
158
-
159
-
160
-
161
-
162
-
163
-
164
-
165
-
166
-
167
-
168
-
169
-
170
-
171
-
172
-
173
-
174
-
175
-
176
-
177
-
178
-
179
-
180
-
181
-
182
-
183
-
184
-
185
-
186
-
187
-
188
-
189
-
190
-
191
-
192
-
193
-
194
-
195
-
196
-
197
-
198
-
199
-
200
-
201
-
202
-
203
-
204
-
205
-
206
-
207
-
208
-
209
-
210
-
211
-
212
-
213
-
214
-
215
-
216
-
217
-
218
-
219
-
220
-
221
-
222
-
223
-
224
-
225
-
226
-
227
-
228
-
229
-
230
-
231
-
232
-
233
-
234
-
235
-
236
-
237
-
238
-
239
-
240
-
241
-
242
-
243
-
244
-
245
-
246
-
247
-
248
-
249
-
250
-
251
-
252
-
253
-
254
-
255
-
256
-
257
-
258
-
259
-
260
-
261
-
262
-
263
-
264
-
265
-
266
-
267
-
268
-
269
-
270
-
271
-
272
-
273
-
274
-
275
-
276
-
277
-
278
-
279
-
280
-
281
-
282
-
283
-
284
-
285
-
286
-
287
-
288
 |
 |
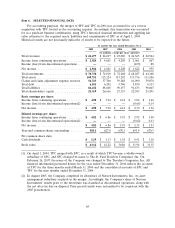
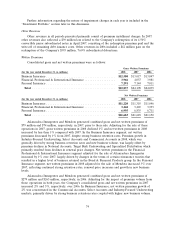
real estate partnerships. The amortized cost of the fixed maturity portfolio at December 31, 2007
totaled $64.15 billion, $1.91 billion higher than year-end 2006. The average pretax investment yield was
5.1% in 2007, compared with 4.9% in 2006. The increase primarily reflected strong returns generated
by the real estate partnerships and higher yields on taxable investments purchased in 2007.
Except as described below for certain legal entities, the Company allocates its invested assets and
the related net investment income to its reportable business segments. Pretax net investment income is
allocated based upon an investable funds concept, which takes into account liabilities (net of
non-invested assets) and appropriate capital considerations for each segment. For investable funds, a
benchmark investment yield is developed that reflects the estimated duration of the loss reserves’ future
cash flows, the interest rate environment at the time the losses were incurred and A+ rated corporate
debt instrument yields. For capital, a benchmark investment yield is developed that reflects the average
yield on the total investment portfolio. The benchmark investment yields are applied to each segment’s
investable funds and capital, respectively, to produce a total notional investment income by segment.
The Company’s actual net investment income is allocated to each segment in proportion to the
respective segment’s notional investment income to total notional investment income. There are certain
legal entities within the Company that are dedicated to specific reportable business segments. The
invested assets and related net investment income from these legal entities are reported in the
applicable business segment and are not allocated.
Fee Income
The National Accounts market in the Business Insurance segment is the primary source of the
Company’s fee-based business. The declines in fee income in 2008 and 2007 compared with the
respective prior years are described in the Business Insurance segment discussion that follows.
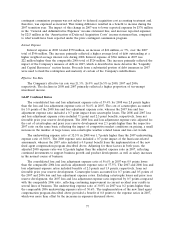
Net Realized Investment Gains (Losses)
Net realized investment losses of $415 million in 2008 were driven by $420 million of investment
impairments. The 2008 impairments included $186 million related to the deteriorated financial position
of various issuers (including $70 million related to securities issued by Lehman Brothers Holdings Inc.
and its subsidiaries), $113 million related to externally managed securities with respect to which the
Company does not have the ability to assert an intention to hold until recovery in market value,
$64 million related to structured mortgage obligations and $57 million related to securities the
Company has identified for potential sales prior to a recovery in market value. Net realized investment
losses in 2008 also included $77 million related to convertible bonds wherein the embedded option
price is marked to market through realized gains or losses and $53 million of losses related to U.S.
Treasury futures contracts (which require a daily mark-to-market settlement and are used to shorten
the duration of the Company’s fixed maturity investment portfolio). Partially offsetting these realized
investment losses in 2008 were net realized gains of $50 million related to foreign currency exchange
gains, $39 million from the sale of subsidiaries and $17 million of net realized investment gains from
the sale of venture capital investments.
Net realized investment gains of $154 million in 2007 included $91 million of net realized
investment gains (net of impairment losses of $16 million) generated by the venture capital portfolio
(including an $81 million net realized investment gain from the bundled sale of a substantial portion of
the Company’s venture capital investment holdings), $63 million of net realized investment gains from
the sale of a privately held security, $21 million of net realized investment gains related to the
Company’s holdings of stock purchase warrants of Platinum Underwriters Holdings, Ltd., a
publicly-held company, and $5 million of net realized investment gains (net of impairment losses of
$37 million) from the Company’s fixed maturity portfolio. These gains were partially offset by a net
realized investment loss of $24 million related to the divestiture of a subsidiary. Net realized investment
gains in 2006 totaled $11 million.
73