Travelers 2008 Annual Report Download - page 194
Download and view the complete annual report
Please find page 194 of the 2008 Travelers annual report below. You can navigate through the pages in the report by either clicking on the pages listed below, or by using the keyword search tool below to find specific information within the annual report.-
 1
1 -
2
-
3
-
4
-
5
-
6
-
7
-
8
-
9
-
10
-
11
-
12
-
13
-
14
-
15
-
16
-
17
-
18
-
19
-
20
-
21
-
22
-
23
-
24
-
25
-
26
-
27
-
28
-
29
-
30
-
31
-
32
-
33
-
34
-
35
-
36
-
37
-
38
-
39
-
40
-
41
-
42
-
43
-
44
-
45
-
46
-
47
-
48
-
49
-
50
-
51
-
52
-
53
-
54
-
55
-
56
-
57
-
58
-
59
-
60
-
61
-
62
-
63
-
64
-
65
-
66
-
67
-
68
-
69
-
70
-
71
-
72
-
73
-
74
-
75
-
76
-
77
-
78
-
79
-
80
-
81
-
82
-
83
-
84
-
85
-
86
-
87
-
88
-
89
-
90
-
91
-
92
-
93
-
94
-
95
-
96
-
97
-
98
-
99
-
100
-
101
-
102
-
103
-
104
-
105
-
106
-
107
-
108
-
109
-
110
-
111
-
112
-
113
-
114
-
115
-
116
-
117
-
118
-
119
-
120
-
121
-
122
-
123
-
124
-
125
-
126
-
127
-
128
-
129
-
130
-
131
-
132
-
133
-
134
-
135
-
136
-
137
-
138
-
139
-
140
-
141
-
142
-
143
-
144
-
145
-
146
-
147
-
148
-
149
-
150
-
151
-
152
-
153
-
154
-
155
-
156
-
157
-
158
-
159
-
160
-
161
-
162
-
163
-
164
-
165
-
166
-
167
-
168
-
169
-
170
-
171
-
172
-
173
-
174
-
175
-
176
-
177
-
178
-
179
-
180
-
181
-
182
-
183
-
 184
184 -
 185
185 -
 186
186 -
 187
187 -
 188
188 -
 189
189 -
 190
190 -
 191
191 -
 192
192 -
 193
193 -
 194
194 -
 195
195 -
 196
196 -
 197
197 -
 198
198 -
 199
199 -
 200
200 -
 201
201 -
 202
202 -
 203
203 -
 204
204 -
205
-
206
-
207
-
208
-
209
-
210
-
211
-
212
-
213
-
214
-
215
-
216
-
217
-
218
-
219
-
220
-
221
-
222
-
223
-
224
-
225
-
226
-
227
-
228
-
229
-
230
-
231
-
232
-
233
-
234
-
235
-
236
-
237
-
238
-
239
-
240
-
241
-
242
-
243
-
244
-
245
-
246
-
247
-
248
-
249
-
250
-
251
-
252
-
253
-
254
-
255
-
256
-
257
-
258
-
259
-
260
-
261
-
262
-
263
-
264
-
265
-
266
-
267
-
268
-
269
-
270
-
271
-
272
-
273
-
274
-
275
-
276
-
277
-
278
-
279
-
280
-
281
-
282
-
283
-
284
-
285
-
286
-
287
-
288
 |
 |

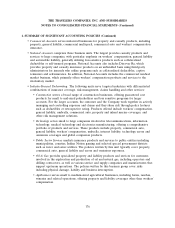
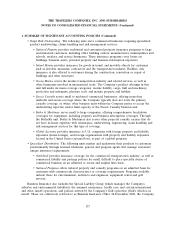
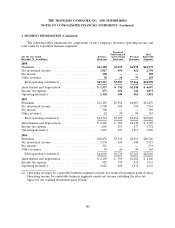
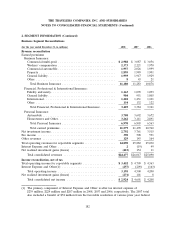
THE TRAVELERS COMPANIES, INC. AND SUBSIDIARIES
NOTES TO CONSOLIDATED FINANCIAL STATEMENTS (Continued)
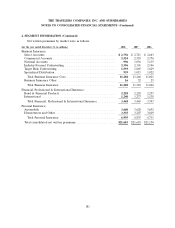
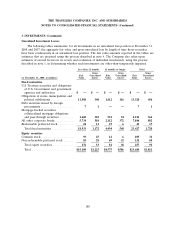
2. SEGMENT INFORMATION (Continued)
Business Segment Reconciliations
(for the year ended December 31, in millions) 2008 2007 2006
Revenue reconciliation
Earned premiums
Business Insurance:
Commercial multi-peril ................................. $ 2,988 $ 3,087 $ 3,056
Workers’ compensation ................................. 2,373 2,221 1,970
Commercial automobile ................................. 1,957 2,026 1,999
Property ............................................ 1,895 1,989 1,901
General liability ....................................... 1,959 1,917 1,929
Other .............................................. 843 21
Total Business Insurance ............................... 11,180 11,283 10,876
Financial, Professional & International Insurance:
Fidelity and surety ..................................... 1,163 1,070 1,093
General liability ....................................... 904 951 1,005
International ......................................... 1,228 1,231 1,101
Other .............................................. 134 132 122
Total Financial, Professional & International Insurance ......... 3,429 3,384 3,321
Personal Insurance:
Automobile .......................................... 3,708 3,692 3,672
Homeowners and Other ................................. 3,262 3,111 2,891
Total Personal Insurance ............................... 6,970 6,803 6,563
Total earned premiums ................................ 21,579 21,470 20,760
Net investment income ..................................... 2,792 3,761 3,515
Fee income ............................................. 390 508 591
Other revenues .......................................... 129 143 164
Total operating revenues for reportable segments .................. 24,890 25,882 25,030
Interest Expense and Other ................................. 2(19) 49
Net realized investment gains (losses) .......................... (415) 154 11
Total consolidated revenues .............................. $24,477 $26,017 $25,090
Income reconciliation, net of tax
Total operating income for reportable segments ................... $ 3,452 $ 4,709 $ 4,363
Interest Expense and Other(1) ............................... (257) (209) (163)
Total operating income ................................. 3,195 4,500 4,200
Net realized investment gains (losses) .......................... (271) 101 8
Total consolidated net income ............................ $ 2,924 $ 4,601 $ 4,208
(1) The primary component of Interest Expense and Other is after-tax interest expense of
$239 million, $224 million and $207 million in 2008, 2007 and 2006, respectively. The 2007 total
also included a benefit of $52 million from the favorable resolution of various prior year federal
182