Travelers 2008 Annual Report Download - page 200
Download and view the complete annual report
Please find page 200 of the 2008 Travelers annual report below. You can navigate through the pages in the report by either clicking on the pages listed below, or by using the keyword search tool below to find specific information within the annual report.-
 1
1 -
2
-
3
-
4
-
5
-
6
-
7
-
8
-
9
-
10
-
11
-
12
-
13
-
14
-
15
-
16
-
17
-
18
-
19
-
20
-
21
-
22
-
23
-
24
-
25
-
26
-
27
-
28
-
29
-
30
-
31
-
32
-
33
-
34
-
35
-
36
-
37
-
38
-
39
-
40
-
41
-
42
-
43
-
44
-
45
-
46
-
47
-
48
-
49
-
50
-
51
-
52
-
53
-
54
-
55
-
56
-
57
-
58
-
59
-
60
-
61
-
62
-
63
-
64
-
65
-
66
-
67
-
68
-
69
-
70
-
71
-
72
-
73
-
74
-
75
-
76
-
77
-
78
-
79
-
80
-
81
-
82
-
83
-
84
-
85
-
86
-
87
-
88
-
89
-
90
-
91
-
92
-
93
-
94
-
95
-
96
-
97
-
98
-
99
-
100
-
101
-
102
-
103
-
104
-
105
-
106
-
107
-
108
-
109
-
110
-
111
-
112
-
113
-
114
-
115
-
116
-
117
-
118
-
119
-
120
-
121
-
122
-
123
-
124
-
125
-
126
-
127
-
128
-
129
-
130
-
131
-
132
-
133
-
134
-
135
-
136
-
137
-
138
-
139
-
140
-
141
-
142
-
143
-
144
-
145
-
146
-
147
-
148
-
149
-
150
-
151
-
152
-
153
-
154
-
155
-
156
-
157
-
158
-
159
-
160
-
161
-
162
-
163
-
164
-
165
-
166
-
167
-
168
-
169
-
170
-
171
-
172
-
173
-
174
-
175
-
176
-
177
-
178
-
179
-
180
-
181
-
182
-
183
-
184
-
185
-
186
-
187
-
188
-
189
-
 190
190 -
 191
191 -
 192
192 -
 193
193 -
 194
194 -
 195
195 -
 196
196 -
 197
197 -
 198
198 -
 199
199 -
 200
200 -
 201
201 -
 202
202 -
 203
203 -
 204
204 -
 205
205 -
 206
206 -
 207
207 -
 208
208 -
 209
209 -
 210
210 -
211
-
212
-
213
-
214
-
215
-
216
-
217
-
218
-
219
-
220
-
221
-
222
-
223
-
224
-
225
-
226
-
227
-
228
-
229
-
230
-
231
-
232
-
233
-
234
-
235
-
236
-
237
-
238
-
239
-
240
-
241
-
242
-
243
-
244
-
245
-
246
-
247
-
248
-
249
-
250
-
251
-
252
-
253
-
254
-
255
-
256
-
257
-
258
-
259
-
260
-
261
-
262
-
263
-
264
-
265
-
266
-
267
-
268
-
269
-
270
-
271
-
272
-
273
-
274
-
275
-
276
-
277
-
278
-
279
-
280
-
281
-
282
-
283
-
284
-
285
-
286
-
287
-
288
 |
 |

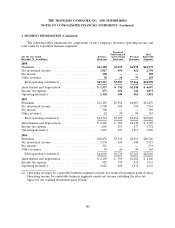
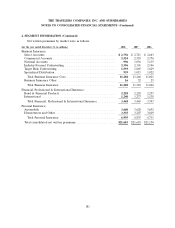
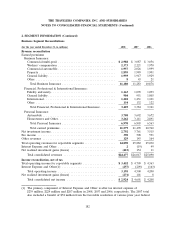
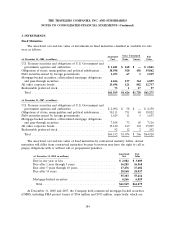
THE TRAVELERS COMPANIES, INC. AND SUBSIDIARIES
NOTES TO CONSOLIDATED FINANCIAL STATEMENTS (Continued)
3. INVESTMENTS (Continued)
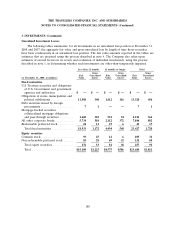
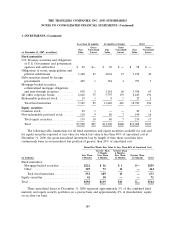
Unrealized Investment Losses
The following tables summarize, for all investments in an unrealized loss position at December 31,
2008 and 2007, the aggregate fair value and gross unrealized loss by length of time those securities
have been continuously in an unrealized loss position. The fair value amounts reported in the tables are
estimates that are prepared using the process described in note 4. The Company also relies upon
estimates of several factors in its review and evaluation of individual investments, using the process
described in note 1, in determining whether such investments are other-than-temporarily impaired.
Less than 12 months 12 months or longer Total
Gross Gross Gross
Fair Unrealized Fair Unrealized Fair Unrealized
(at December 31, 2008, in millions) Value Losses Value Losses Value Losses
Fixed maturities
U.S. Treasury securities and obligations
of U.S. Government and government
agencies and authorities .......... $—$—$— $— $—$—
Obligations of states, municipalities and
political subdivisions ............. 11,508 340 1,812 116 13,320 456
Debt securities issued by foreign
governments ................... 71—— 71
Mortgage-backed securities,
collateralized mortgage obligations
and pass-through securities ........ 1,660 310 551 54 2,211 364
All other corporate bonds ........... 5,734 510 2,112 372 7,846 882
Redeemable preferred stock ......... 24 11 19 6 43 17
Total fixed maturities ............ 18,933 1,172 4,494 548 23,427 1,720
Equity securities
Common stock ................... 93 25 12 6 105 31
Non-redeemable preferred stock ...... 83 28 69 32 152 60
Total equity securities ............ 176 53 81 38 257 91
Total ........................ $19,109 $1,225 $4,575 $586 $23,684 $1,811
188