Metro PCS 2008 Annual Report Download - page 88
Download and view the complete annual report
Please find page 88 of the 2008 Metro PCS annual report below. You can navigate through the pages in the report by either clicking on the pages listed below, or by using the keyword search tool below to find specific information within the annual report.-
 1
1 -
2
-
3
-
4
-
5
-
6
-
7
-
8
-
9
-
10
-
11
-
12
-
13
-
14
-
15
-
16
-
17
-
18
-
19
-
20
-
21
-
22
-
23
-
24
-
25
-
26
-
27
-
28
-
29
-
30
-
31
-
32
-
33
-
34
-
35
-
36
-
37
-
38
-
39
-
40
-
41
-
42
-
43
-
44
-
45
-
46
-
47
-
48
-
49
-
50
-
51
-
52
-
53
-
54
-
55
-
56
-
57
-
58
-
59
-
60
-
61
-
62
-
63
-
64
-
65
-
66
-
67
-
68
-
69
-
70
-
71
-
72
-
73
-
74
-
75
-
76
-
77
-
 78
78 -
 79
79 -
 80
80 -
 81
81 -
 82
82 -
 83
83 -
 84
84 -
 85
85 -
 86
86 -
 87
87 -
 88
88 -
 89
89 -
 90
90 -
 91
91 -
 92
92 -
 93
93 -
 94
94 -
 95
95 -
 96
96 -
 97
97 -
 98
98 -
99
-
100
-
101
-
102
-
103
-
104
-
105
-
106
-
107
-
108
-
109
-
110
-
111
-
112
-
113
-
114
-
115
-
116
-
117
-
118
-
119
-
120
-
121
-
122
-
123
-
124
-
125
-
126
-
127
-
128
-
129
-
130
-
131
-
132
-
133
-
134
-
135
-
136
-
137
-
138
-
139
-
140
-
141
-
142
-
143
-
144
-
145
-
146
-
147
-
148
-
149
-
150
-
151
-
152
 |
 |

79
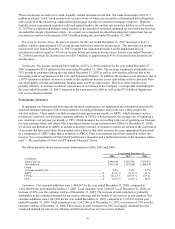
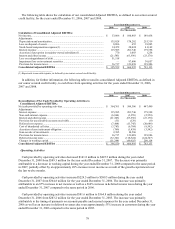
The following table shows the calculation of our consolidated Adjusted EBITDA, as defined in our senior secured
credit facility, for the years ended December 31, 2006, 2007 and 2008.
Year Ended December 31,
2006 2007 2008
(In Thousands)
Calculation of Consolidated Adjusted EBITDA:
Net income............................................................................................................ $ 53,806 $ 100,403 $ 149,438
Adjustments:
Depreciation and amortization............................................................................. 135,028 178,202 255,319
Loss on disposal of assets .................................................................................... 8,806 655 18,905
Stock-based compensation expense(1) ................................................................ 14,472 28,024 41,142
Interest expense ................................................................................................... 115,985 201,746 179,398
Accretion of put option in majority-owned subsidiary(1).................................... 770 1,003 1,258
Interest and other income..................................................................................... (21,543) (63,936) (23,170)
Loss on extinguishment of debt ........................................................................... 51,518 — —
Impairment loss on investment securities ............................................................ — 97,800 30,857
Provision for income taxes................................................................................... 36,717 123,098 129,986
Consolidated Adjusted EBITDA ....................................................................... $ 395,559 $ 666,995 $ 783,133
_______________________
(1) Represents a non-cash expense, as defined by our senior secured credit facility.
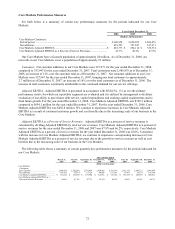
In addition, for further information, the following table reconciles consolidated Adjusted EBITDA, as defined in
our senior secured credit facility, to cash flows from operating activities for the years ended December 31, 2006,
2007 and 2008.
Year Ended December 31,
2006 2007 2008
(In Thousands)
Reconciliation of Net Cash Provided by Operating Activities to
Consolidated Adjusted EBITDA:
Net cash provided by operating activities ............................................................. $ 364,761 $ 589,306 $ 447,490
Adjustments:
Interest expense ................................................................................................... 115,985 201,746 179,398
Non-cash interest expense.................................................................................... (6,964) (3,259) (2,550)
Interest and other income..................................................................................... (21,543) (63,936) (23,170)
Provision for uncollectible accounts receivable................................................... (31) (129) (8)
Deferred rent expense.......................................................................................... (7,464) (13,745) (20,646)
Cost of abandoned cell sites................................................................................. (3,783) (6,704) (8,592)
Accretion of asset retirement obligation .............................................................. (769) (1,439) (3,542)
Gain on sale of investments ................................................................................. 2,385 10,506 —
Provision for income taxes................................................................................... 36,717 123,098 129,986
Deferred income taxes ......................................................................................... (32,341) (118,524) (124,347)
Changes in working capital.................................................................................. (51,394) (49,925) 209,114
Consolidated Adjusted EBITDA ....................................................................... $ 395,559 $ 666,995 $ 783,133
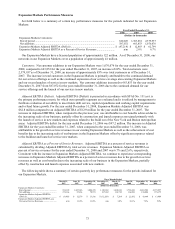
Operating Activities
Cash provided by operating activities decreased $141.8 million to $447.5 million during the year ended
December 31, 2008 from $589.3 million for the year ended December 31, 2007. The decrease was primarily
attributable to a decrease in working capital during the year ended December 31, 2008 compared to the same period
in 2007, partially offset by an approximately 49% increase in net income as a result of the growth experienced over
the last twelve months.
Cash provided by operating activities increased $224.5 million to $589.3 million during the year ended
December 31, 2007 from $364.8 million for the year ended December 31, 2006. The increase was primarily
attributable to an 87% increase in net income as well as a 266% increase in deferred income taxes during the year
ended December 31, 2007 compared to the same period in 2006.
Cash provided by operating activities increased $81.6 million to $364.8 million during the year ended
December 31, 2006 from $283.2 million for the year ended December 31, 2005. The increase was primarily
attributable to the timing of payments on accounts payable and accrued expenses for the year ended December 31,
2006 as well as an increase in deferred revenues due to an approximately 53% increase in customers during the year
ended December 31, 2006 compared to the same period in 2005.