Metro PCS 2008 Annual Report Download - page 125
Download and view the complete annual report
Please find page 125 of the 2008 Metro PCS annual report below. You can navigate through the pages in the report by either clicking on the pages listed below, or by using the keyword search tool below to find specific information within the annual report.-
 1
1 -
2
-
3
-
4
-
5
-
6
-
7
-
8
-
9
-
10
-
11
-
12
-
13
-
14
-
15
-
16
-
17
-
18
-
19
-
20
-
21
-
22
-
23
-
24
-
25
-
26
-
27
-
28
-
29
-
30
-
31
-
32
-
33
-
34
-
35
-
36
-
37
-
38
-
39
-
40
-
41
-
42
-
43
-
44
-
45
-
46
-
47
-
48
-
49
-
50
-
51
-
52
-
53
-
54
-
55
-
56
-
57
-
58
-
59
-
60
-
61
-
62
-
63
-
64
-
65
-
66
-
67
-
68
-
69
-
70
-
71
-
72
-
73
-
74
-
75
-
76
-
77
-
78
-
79
-
80
-
81
-
82
-
83
-
84
-
85
-
86
-
87
-
88
-
89
-
90
-
91
-
92
-
93
-
94
-
95
-
96
-
97
-
98
-
99
-
100
-
101
-
102
-
103
-
104
-
105
-
106
-
107
-
108
-
109
-
110
-
111
-
112
-
113
-
114
-
 115
115 -
 116
116 -
 117
117 -
 118
118 -
 119
119 -
 120
120 -
 121
121 -
 122
122 -
 123
123 -
 124
124 -
 125
125 -
 126
126 -
 127
127 -
 128
128 -
 129
129 -
 130
130 -
 131
131 -
 132
132 -
 133
133 -
 134
134 -
 135
135 -
136
-
137
-
138
-
139
-
140
-
141
-
142
-
143
-
144
-
145
-
146
-
147
-
148
-
149
-
150
-
151
-
152
 |
 |

MetroPCS Communications, Inc. and Subsidiaries
Notes to Consolidated Financial Statements
December 31, 2008, 2007 and 2006
F-23
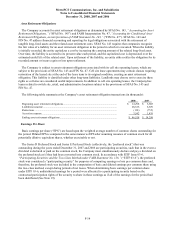
The estimated fair values of the Company’s financial instruments are as follows (in thousands):
2008 2007
Carrying
Amount Fair Value
Carrying
Amount Fair Value
Senior Secured Credit Facility........................................................ $ 1,564,000 $ 1,251,200 $ 1,580,000 $ 1,607,734
9¼% Senior Notes.......................................................................... 1,400,000 1,239,000 1,400,000 1,314,250
Cash flow hedging derivatives........................................................ 54,963 54,963 23,502 23,502
Long-term investments................................................................... 5,986 5,986 36,050 36,050
11. Concentrations:
The Company purchases a substantial portion of its wireless infrastructure equipment and handset equipment
from only a few major suppliers. Further, the Company generally relies on one key vendor in each of the following
areas: network infrastructure equipment, billing services, customer care, handset logistics and long distance services.
Loss of any of these suppliers could adversely affect operations temporarily until a comparable substitute could be
found. Verisign, the Company’s existing billing system provider, publicly announced that it plans to leave the
telecommunications services business, including the billing services business. On September 15, 2008, the
Company entered into a managed services agreement with Amdocs Software Systems Limited and Amdocs, Inc.
(“Amdocs”). The Company is currently transitioning its billing systems to Amdocs.
Local and long distance telephone and other companies provide certain communication services to the Company.
Disruption of these services could adversely affect operations in the short term until an alternative
telecommunication provider was found.
Concentrations of credit risk with respect to trade accounts receivable are limited due to the diversity of the
Company’s indirect retailer base.
12. Commitments and Contingencies:
Operating and Capital Leases
The Company has entered into non-cancelable operating lease agreements to lease facilities, certain equipment
and sites for towers and antennas required for the operation of its wireless networks. Total rent expense for the years
ended December 31, 2008, 2007 and 2006 was $199.1 million, $125.1 million and $85.5 million, respectively.
The Company entered into various non-cancelable DAS capital lease agreements, with varying expiration terms
through 2024, covering dedicated optical fiber.
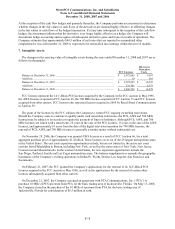
Future annual minimum rental payments required for all non-cancelable operating and capital leases at
December 31, 2008 are as follows (in thousands):
Operating Leases Capital Leases
For the Year Ending December 31,
2009................................................................................................................ $ 204,296 $ 10,213
2010................................................................................................................ 209,999 10,521
2011................................................................................................................ 209,157 10,836
2012................................................................................................................ 198,270 11,162
2013................................................................................................................ 199,961 11,496
Thereafter ....................................................................................................... 731,327 132,271
Total minimum future lease payments............................................................ $ 1,753,010 186,499
Amount representing interest.......................................................................... (95,156)
Present value of minimum lease payments..................................................... 91,343
Current portion ............................................................................................... (1,009)
Long-term capital lease obligations ................................................................ $ 90,334