Metro PCS 2008 Annual Report Download - page 135
Download and view the complete annual report
Please find page 135 of the 2008 Metro PCS annual report below. You can navigate through the pages in the report by either clicking on the pages listed below, or by using the keyword search tool below to find specific information within the annual report.-
 1
1 -
2
-
3
-
4
-
5
-
6
-
7
-
8
-
9
-
10
-
11
-
12
-
13
-
14
-
15
-
16
-
17
-
18
-
19
-
20
-
21
-
22
-
23
-
24
-
25
-
26
-
27
-
28
-
29
-
30
-
31
-
32
-
33
-
34
-
35
-
36
-
37
-
38
-
39
-
40
-
41
-
42
-
43
-
44
-
45
-
46
-
47
-
48
-
49
-
50
-
51
-
52
-
53
-
54
-
55
-
56
-
57
-
58
-
59
-
60
-
61
-
62
-
63
-
64
-
65
-
66
-
67
-
68
-
69
-
70
-
71
-
72
-
73
-
74
-
75
-
76
-
77
-
78
-
79
-
80
-
81
-
82
-
83
-
84
-
85
-
86
-
87
-
88
-
89
-
90
-
91
-
92
-
93
-
94
-
95
-
96
-
97
-
98
-
99
-
100
-
101
-
102
-
103
-
104
-
105
-
106
-
107
-
108
-
109
-
110
-
111
-
112
-
113
-
114
-
115
-
116
-
117
-
118
-
119
-
120
-
121
-
122
-
123
-
124
-
 125
125 -
 126
126 -
 127
127 -
 128
128 -
 129
129 -
 130
130 -
 131
131 -
 132
132 -
 133
133 -
 134
134 -
 135
135 -
 136
136 -
 137
137 -
 138
138 -
 139
139 -
 140
140 -
 141
141 -
 142
142 -
 143
143 -
 144
144 -
 145
145 -
146
-
147
-
148
-
149
-
150
-
151
-
152
 |
 |

MetroPCS Communications, Inc. and Subsidiaries
Notes to Consolidated Financial Statements
December 31, 2008, 2007 and 2006
F-33
19. Net Income Per Common Share:
The following table sets forth the computation of basic and diluted net income per common share for the periods
indicated (in thousands, except share and per share data):
2008 2007 2006
Basic EPS — Two Class Method:
Net income ............................................................................... $ 149,438 $ 100,403 $ 53,806
Accrued dividends and accretion:
Series D Preferred Stock......................................................... — (6,647) (21,479)
Series E Preferred Stock ......................................................... — (1,035) (3,339)
Net income applicable to common stock.................................. $ 149,438 $ 92,721 $ 28,988
Amount allocable to common shareholders.............................. 100.0% 88.8% 57.1%
Rights to undistributed earnings ............................................... $ 149,438 $ 82,330 $ 16,539
Weighted average shares outstanding — basic......................... 349,395,285 287,692,280 155,820,381
Net income per common share — basic ................................... $ 0.43 $ 0.29 $ 0.11
Diluted EPS:
Rights to undistributed earnings ............................................... $ 149,438 $ 82,330 $ 16,539
Weighted average shares outstanding — basic......................... 349,395,285 287,692,280 155,820,381
Effect of dilutive securities:
Warrants ................................................................................. — — 147,257
Stock options .......................................................................... 5,984,826 8,645,444 3,728,970
Weighted average shares outstanding — diluted...................... 355,380,111 296,337,724 159,696,608
Net income per common share — diluted ................................ $ 0.42 $ 0.28 $ 0.10
Net income per common share for the years ended December 31, 2007 and 2006 is computed in accordance with
EITF 03-6. Under EITF 03-6, the preferred stock is considered a “participating security” for purposes of computing
earnings or loss per common share and, therefore, the preferred stock is included in the computation of basic and
diluted net income per common share using the two-class method, except during periods of net losses. Preferred
stock was included in the computation of income per common share through April 24, 2007, the date of conversion
to common stock as a result of the Offering. When determining basic earnings per common share under EITF 03-6,
undistributed earnings for a period are allocated to a participating security based on the contractual participation
rights of the security to share in those earnings as if all of the earnings for the period had been distributed.
For the years ended December 31, 2008, 2007 and 2006, 11.9 million, 4.4 million and 7.4 million, respectively, of
stock options were excluded from the calculation of diluted net income per common share since the effect was anti-
dilutive.
For the years ended December 31, 2007 and 2006, 44.2 million and 136.1 million, respectively, of convertible
shares of Series D Preferred Stock were excluded from the calculation of diluted net income per common share
since the effect was anti-dilutive.
For the years ended December 31, 2007 and 2006, 1.9 million and 5.7 million, respectively, of convertible shares
of Series E Preferred Stock were excluded from the calculation of diluted net income per common share since the
effect was anti-dilutive.
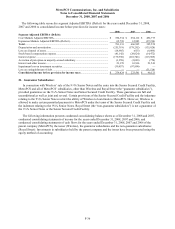
20. Segment Information:
Operating segments are defined by SFAS No. 131 as components of an enterprise about which separate financial
information is available that is evaluated regularly by the chief operating decision maker in deciding how to allocate
resources and in assessing performance. The Company’s chief operating decision maker is the President, Chief
Executive Officer and Chairman of the Board.