Metro PCS 2008 Annual Report Download - page 81
Download and view the complete annual report
Please find page 81 of the 2008 Metro PCS annual report below. You can navigate through the pages in the report by either clicking on the pages listed below, or by using the keyword search tool below to find specific information within the annual report.-
 1
1 -
2
-
3
-
4
-
5
-
6
-
7
-
8
-
9
-
10
-
11
-
12
-
13
-
14
-
15
-
16
-
17
-
18
-
19
-
20
-
21
-
22
-
23
-
24
-
25
-
26
-
27
-
28
-
29
-
30
-
31
-
32
-
33
-
34
-
35
-
36
-
37
-
38
-
39
-
40
-
41
-
42
-
43
-
44
-
45
-
46
-
47
-
48
-
49
-
50
-
51
-
52
-
53
-
54
-
55
-
56
-
57
-
58
-
59
-
60
-
61
-
62
-
63
-
64
-
65
-
66
-
67
-
68
-
69
-
70
-
 71
71 -
 72
72 -
 73
73 -
 74
74 -
 75
75 -
 76
76 -
 77
77 -
 78
78 -
 79
79 -
 80
80 -
 81
81 -
 82
82 -
 83
83 -
 84
84 -
 85
85 -
 86
86 -
 87
87 -
 88
88 -
 89
89 -
 90
90 -
 91
91 -
92
-
93
-
94
-
95
-
96
-
97
-
98
-
99
-
100
-
101
-
102
-
103
-
104
-
105
-
106
-
107
-
108
-
109
-
110
-
111
-
112
-
113
-
114
-
115
-
116
-
117
-
118
-
119
-
120
-
121
-
122
-
123
-
124
-
125
-
126
-
127
-
128
-
129
-
130
-
131
-
132
-
133
-
134
-
135
-
136
-
137
-
138
-
139
-
140
-
141
-
142
-
143
-
144
-
145
-
146
-
147
-
148
-
149
-
150
-
151
-
152
 |
 |

72
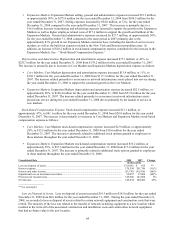
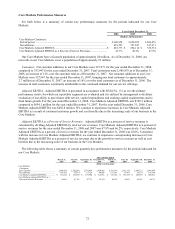
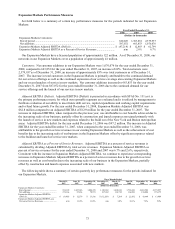
Core Markets Performance Measures
Set forth below is a summary of certain key performance measures for the periods indicated for our Core
Markets:
Year Ended December 31,
2006 2007 2008
(Dollars in thousands)
Core Markets Customers:
End of period ..........................................................................................................
.
2,300,958 2,658,905 2,986,876
Net additions...........................................................................................................
.
429,293 357,947 327,971
Core Markets Adjusted EBITDA.............................................................................
.
$ 492,773 $ 654,112 $ 720,334
Core Markets Adjusted EBITDA as a Percent of Service Revenues .......................
.
43.3% 46.2% 47.9%
Our Core Markets have a licensed population of approximately 28 million. As of December 31, 2008, our
networks in our Core Markets cover a population of approximately 23 million.
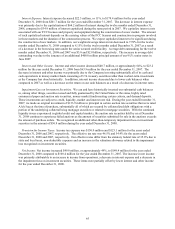
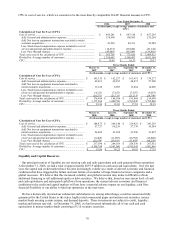
Customers. Net customer additions in our Core Markets were 327,971 for the year ended December 31, 2008,
compared to 357,947 for the year ended December 31, 2007. Total customers were 2,986,876 as of December 31,
2008, an increase of 12% over the customer total as of December 31, 2007. Net customer additions in our Core
Markets were 357,947 for the year ended December 31, 2007, bringing our total customers to approximately
2.7 million as of December 31, 2007, an increase of 16% over the total customers as of December 31, 2006. The
increase in total customers is primarily attributable to the continued demand for our service offerings.
Adjusted EBITDA. Adjusted EBITDA is presented in accordance with SFAS No. 131 as it is the primary
performance metric for which our reportable segments are evaluated and it is utilized by management to facilitate
evaluation of our ability to meet future debt service, capital expenditures and working capital requirements and to
fund future growth. For the year ended December 31, 2008, Core Markets Adjusted EBITDA was $720.3 million
compared to $654.1 million for the year ended December 31, 2007. For the year ended December 31, 2006, Core
Markets Adjusted EBITDA was $492.8 million. We continue to experience increases in Core Markets Adjusted
EBITDA as a result of continued customer growth and cost benefits due to the increasing scale of our business in the
Core Markets.
Adjusted EBITDA as a Percent of Service Revenues. Adjusted EBITDA as a percent of service revenues is
calculated by dividing Adjusted EBITDA by total service revenues. Core Markets Adjusted EBITDA as a percent of
service revenues for the year ended December 31, 2008 and 2007 was 47.9% and 46.2%, respectively. Core Markets
Adjusted EBITDA as a percent of service revenues for the year ended December 31, 2006 was 43.0%. Consistent
with the increase in Core Markets Adjusted EBITDA, we continue to experience corresponding increases in Core
Markets Adjusted EBITDA as a percent of service revenues due to the growth in service revenues as well as cost
benefits due to the increasing scale of our business in the Core Markets.
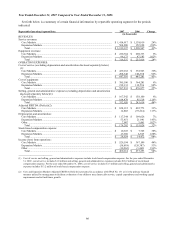
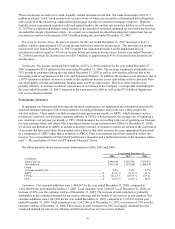
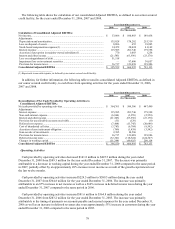
The following table shows a summary of certain quarterly key performance measures for the periods indicated for
our Core Markets.
Three Months Ended
March 31,
2007
June 30,
2007
September 30,
2007
December 3 1,
2007
March 31,
2008
June 30,
2008
September 30,
2008
December 3 1,
2008
(Dollars in thousands)
Core Markets
Customers:
End of period ...............................................
.
2,484,811 2,542,290 2,578,019 2,658,905 2,795,916 2,815,353 2,845,732 2,986,876
Net additions................................................
.
183,853 57,479 35,729 80,886 137,011 19,437 30,379 141,144
Core Markets Adjusted EBITDA.................
.
$ 150,321 $ 167,869 $ 170,984 $ 164,938 $ 170,526 $ 187,335 $ 182,189 $ 180,284
Core Markets Adjusted EBITDA as a
Percent of Service Revenues ......................
.
44.6% 47.1% 47.7% 45.4% 46.2% 49.6% 49.0% 46.7%