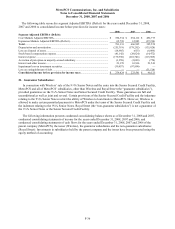
Metro PCS 2008 Annual Report Download - page 141
Download and view the complete annual report
Please find page 141 of the 2008 Metro PCS annual report below. You can navigate through the pages in the report by either clicking on the pages listed below, or by using the keyword search tool below to find specific information within the annual report.-
 1
1 -
2
-
3
-
4
-
5
-
6
-
7
-
8
-
9
-
10
-
11
-
12
-
13
-
14
-
15
-
16
-
17
-
18
-
19
-
20
-
21
-
22
-
23
-
24
-
25
-
26
-
27
-
28
-
29
-
30
-
31
-
32
-
33
-
34
-
35
-
36
-
37
-
38
-
39
-
40
-
41
-
42
-
43
-
44
-
45
-
46
-
47
-
48
-
49
-
50
-
51
-
52
-
53
-
54
-
55
-
56
-
57
-
58
-
59
-
60
-
61
-
62
-
63
-
64
-
65
-
66
-
67
-
68
-
69
-
70
-
71
-
72
-
73
-
74
-
75
-
76
-
77
-
78
-
79
-
80
-
81
-
82
-
83
-
84
-
85
-
86
-
87
-
88
-
89
-
90
-
91
-
92
-
93
-
94
-
95
-
96
-
97
-
98
-
99
-
100
-
101
-
102
-
103
-
104
-
105
-
106
-
107
-
108
-
109
-
110
-
111
-
112
-
113
-
114
-
115
-
116
-
117
-
118
-
119
-
120
-
121
-
122
-
123
-
124
-
125
-
126
-
127
-
128
-
129
-
130
-
 131
131 -
 132
132 -
 133
133 -
 134
134 -
 135
135 -
 136
136 -
 137
137 -
 138
138 -
 139
139 -
 140
140 -
 141
141 -
 142
142 -
 143
143 -
 144
144 -
 145
145 -
 146
146 -
 147
147 -
 148
148 -
 149
149 -
 150
150 -
 151
151 -
152
 |
 |

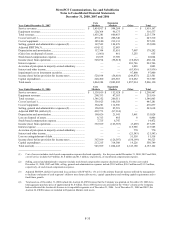
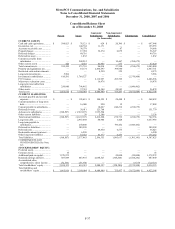
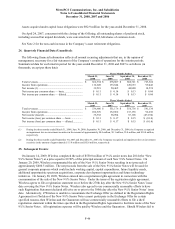
MetroPCS Communications, Inc. and Subsidiaries
Notes to Consolidated Financial Statements
December 31, 2008, 2007 and 2006
F-39
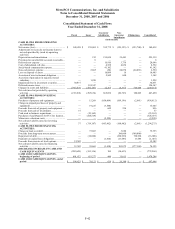
Consolidated Statement of Income
Year Ended December 31, 2008
Parent Issuer
Guarantor
Subsidiaries
Non-Guarantor
Subsidiaries Eliminations Consolidated
(in thousands)
REVENUES:
Service revenues........................................ $ — $ — $ 2,441,374 $ 98,179 $ (102,303) $ 2,437,250
Equipment revenues .................................. — 11,977 302,289 — — 314,266
Total revenues ................................. — 11,977 2,743,663 98,179 (102,303) 2,751,516
OPERATING EXPENSES:
Cost of service (excluding
depreciation and amortization
expense shown separately below)...... — — 869,063 90,535 (102,303) 857,295
Cost of equipment ..................................... — 11,292 693,356 — — 704,648
Selling, general and administrative
expenses (excluding depreciation and
amortization expense shown separately
below) ..................................................... — 684 425,889 21,009 — 447,582
Depreciation and amortization .................. — 212 215,624 39,483 — 255,319
Loss on disposal of assets ......................... — — 18,889 16 — 18,905
Total operating expenses................. — 12,188 2,222,821 151,043 (102,303) 2,283,749
Income (loss) from operations .................. — (211) 520,842 (52,864) — 467,767
OTHER EXPENSE (INCOME):
Interest expense ......................................... — 219,530 (32,665) 102,931 (110,398) 179,398
Earnings from consolidated subsidiaries .. (158,083) (397,617) — — 555,700 —
Accretion of put option in majority-
owned subsidiary .................................... — 1,258 — — — 1,258
Interest and other income .......................... (22,212) (110,796) 80 (640) 110,398 (23,170)
Impairment loss on investment securities. 30,857 — — — — 30,857
Total other (income) expense .......... (149,438) (287,625) (32,585) 102,291 555,700 188,343
Income (loss) before provision for
income taxes ........................................... 149,438 287,414 553,427 (155,155) (555,700) 279,424
Provision for income taxes........................ — (129,331) (655) — — (129,986)
Net income (loss) ...................................... $ 149,438 $ 158,083 $ 552,772 $ (155,155) $ (555,700) $ 149,438