Metro PCS 2008 Annual Report Download - page 112
Download and view the complete annual report
Please find page 112 of the 2008 Metro PCS annual report below. You can navigate through the pages in the report by either clicking on the pages listed below, or by using the keyword search tool below to find specific information within the annual report.-
 1
1 -
2
-
3
-
4
-
5
-
6
-
7
-
8
-
9
-
10
-
11
-
12
-
13
-
14
-
15
-
16
-
17
-
18
-
19
-
20
-
21
-
22
-
23
-
24
-
25
-
26
-
27
-
28
-
29
-
30
-
31
-
32
-
33
-
34
-
35
-
36
-
37
-
38
-
39
-
40
-
41
-
42
-
43
-
44
-
45
-
46
-
47
-
48
-
49
-
50
-
51
-
52
-
53
-
54
-
55
-
56
-
57
-
58
-
59
-
60
-
61
-
62
-
63
-
64
-
65
-
66
-
67
-
68
-
69
-
70
-
71
-
72
-
73
-
74
-
75
-
76
-
77
-
78
-
79
-
80
-
81
-
82
-
83
-
84
-
85
-
86
-
87
-
88
-
89
-
90
-
91
-
92
-
93
-
94
-
95
-
96
-
97
-
98
-
99
-
100
-
101
-
 102
102 -
 103
103 -
 104
104 -
 105
105 -
 106
106 -
 107
107 -
 108
108 -
 109
109 -
 110
110 -
 111
111 -
 112
112 -
 113
113 -
 114
114 -
 115
115 -
 116
116 -
 117
117 -
 118
118 -
 119
119 -
 120
120 -
 121
121 -
 122
122 -
123
-
124
-
125
-
126
-
127
-
128
-
129
-
130
-
131
-
132
-
133
-
134
-
135
-
136
-
137
-
138
-
139
-
140
-
141
-
142
-
143
-
144
-
145
-
146
-
147
-
148
-
149
-
150
-
151
-
152
 |
 |

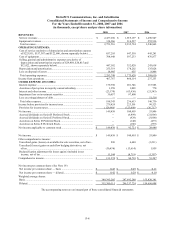
MetroPCS Communications, Inc. and Subsidiaries
Notes to Consolidated Financial Statements
December 31, 2008, 2007 and 2006
F-10
Cash and Cash Equivalents
The Company includes as cash and cash equivalents (i) cash on hand, (ii) cash in bank accounts, (iii) investments
in money market funds, and (iv) treasury securities with an original maturity of 90 days or less.
Inventories
Substantially all of the Company’s inventories are stated at the lower of average cost or market. Inventories
consist mainly of handsets that are available for sale to customers and independent retailers.
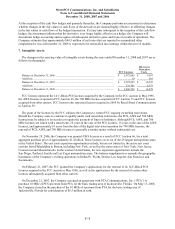
Allowance for Uncollectible Accounts Receivable
The Company maintains allowances for uncollectible accounts for estimated losses resulting from the inability of
independent retailers to pay for equipment purchases and for amounts estimated to be uncollectible from other
carriers. The following table summarizes the changes in the Company’s allowance for uncollectible accounts (in
thousands):
2008 2007 2006
Balance at beginning of period.................................................................... $ 2,908 $ 1,950 $ 2,383
Additions:
Charged to expense................................................................................... 8 129 31
Direct reduction to revenue and other accounts........................................ 1,337 1,037 929
Deductions................................................................................................... (147) (208) (1,393)
Balance at end of period .............................................................................. $ 4,106 $ 2,908 $ 1,950
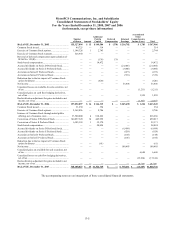
Prepaid Charges
Prepaid charges consisted of the following (in thousands):
2008 2007
Prepaid vendor purchases ................................................................................................ $ 17,829 $ 37,054
Prepaid rent ..................................................................................................................... 23,689 13,996
Prepaid maintenance and support contracts..................................................................... 4,482 3,961
Prepaid insurance ............................................................................................................ 2,165 2,162
Prepaid advertising .......................................................................................................... 2,331 264
Other................................................................................................................................ 5,851 3,032
Prepaid charges................................................................................................................ $ 56,347 $ 60,469
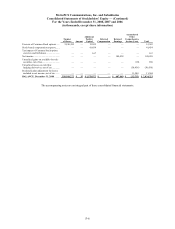
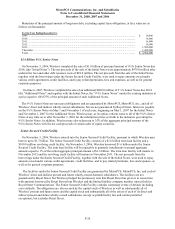
Property and Equipment
Property and equipment, net, consisted of the following (in thousands):
2008 2007
Construction-in-progress ..................................................................................... $ 898,454 $ 393,282
Network infrastructure......................................................................................... 2,522,206 1,901,119
Office equipment................................................................................................. 63,848 44,059
Leasehold improvements..................................................................................... 47,784 33,410
Furniture and fixtures .......................................................................................... 10,273 7,833
Vehicles............................................................................................................... 311 207
3,542,876 2,379,910
Accumulated depreciation and amortization ....................................................... (695,125) (488,499)
Property and equipment, net................................................................................ $ 2,847,751 $ 1,891,411
Property and equipment are stated at cost. Additions and improvements are capitalized, while expenditures that
do not enhance or extend the asset’s useful life are charged to operating expenses as incurred. When the Company
sells, disposes of or retires property and equipment, the related gains or losses are included in operating results.
Depreciation is applied using the straight-line method over the estimated useful lives of the assets once the assets are
placed in service, which are seven to ten years for network infrastructure assets, three to ten years for capitalized