Metro PCS 2008 Annual Report Download - page 60
Download and view the complete annual report
Please find page 60 of the 2008 Metro PCS annual report below. You can navigate through the pages in the report by either clicking on the pages listed below, or by using the keyword search tool below to find specific information within the annual report.-
 1
1 -
2
-
3
-
4
-
5
-
6
-
7
-
8
-
9
-
10
-
11
-
12
-
13
-
14
-
15
-
16
-
17
-
18
-
19
-
20
-
21
-
22
-
23
-
24
-
25
-
26
-
27
-
28
-
29
-
30
-
31
-
32
-
33
-
34
-
35
-
36
-
37
-
38
-
39
-
40
-
41
-
42
-
43
-
44
-
45
-
46
-
47
-
48
-
49
-
 50
50 -
 51
51 -
 52
52 -
 53
53 -
 54
54 -
 55
55 -
 56
56 -
 57
57 -
 58
58 -
 59
59 -
 60
60 -
 61
61 -
 62
62 -
 63
63 -
 64
64 -
 65
65 -
 66
66 -
 67
67 -
 68
68 -
 69
69 -
 70
70 -
71
-
72
-
73
-
74
-
75
-
76
-
77
-
78
-
79
-
80
-
81
-
82
-
83
-
84
-
85
-
86
-
87
-
88
-
89
-
90
-
91
-
92
-
93
-
94
-
95
-
96
-
97
-
98
-
99
-
100
-
101
-
102
-
103
-
104
-
105
-
106
-
107
-
108
-
109
-
110
-
111
-
112
-
113
-
114
-
115
-
116
-
117
-
118
-
119
-
120
-
121
-
122
-
123
-
124
-
125
-
126
-
127
-
128
-
129
-
130
-
131
-
132
-
133
-
134
-
135
-
136
-
137
-
138
-
139
-
140
-
141
-
142
-
143
-
144
-
145
-
146
-
147
-
148
-
149
-
150
-
151
-
152
 |
 |

51
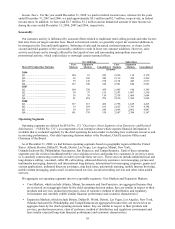
Item 6. Selected Financial Data
The following tables set forth selected consolidated financial data. We derived our selected consolidated financial
data as of and for the years ended December 31, 2004, 2005, 2006, 2007 and 2008 from our consolidated financial
statements. The historical selected financial data may not be indicative of future performance and should be read in
conjunction with “Management’s Discussion and Analysis of Financial Condition and Results of Operations” and
“Risk Factors” in this report.
Year Ended December 31,
2004 2005 2006 2007 2008
(In Thousands, Except Share and Per Share Data)
Statement of Operations Data:
Revenues:
Service revenues................................................................................................... $ 616,401 $ 872,100 $ 1,290,947 $ 1,919,197 $ 2,437,250
Equipment revenues ............................................................................................. 131,849 166,328 255,916 316,537 314,266
Total revenues ..................................................................................................... 748,250 1,038,428 1,546,863 2,235,734 2,751,516
Operating expenses:
Cost of service (excluding depreciation and amortization disclosed separately
below) ................................................................................................................ 200,806 283,212 445,281 647,510 857,295
Cost of equipment ................................................................................................ 222,766 300,871 476,877 597,233 704,648
Selling, general and administrative expenses (excluding depreciation and
amortization disclosed separately below).......................................................... 131,510 162,476 243,618 352,020 447,582
Depreciation and amortization ............................................................................. 62,201 87,895 135,028 178,202 255,319
Loss (gain) on disposal of assets.......................................................................... 3,209 (218,203
)
8,806 655 18,905
Total operating expenses..................................................................................... 620,492 616,251 1,309,610 1,775,620 2,283,749
Income from operations......................................................................................... 127,758 422,177 237,253 460,114 467,767
Other expense (income):
Interest expense .................................................................................................... 19,030 58,033 115,985 201,746 179,398
Accretion of put option in majority-owned subsidiary........................................ 8 252 770 1,003 1,258
Interest and other income ..................................................................................... (2,472) (8,658
)
(21,543
)
(63,936
)
(23,170
)
Impairment loss on investment securities ............................................................ — — — 97,800 30,857
(Gain) loss on extinguishment of debt ................................................................. (698) 46,448 51,518 — —
Total other expense ............................................................................................. 15,868 96,075 146,730 236,613 188,343
Income before provision for income taxes............................................................ 111,890 326,102 90,523 223,501 279,424
Provision for income taxes .................................................................................... (47,000) (127,425
)
(36,717
)
(123,098
)
(129,986
)
Net income............................................................................................................. 64,890 198,677 53,806 100,403 149,438
Accrued dividends on Series D Preferred Stock................................................... (21,006) (21,006
)
(21,006
)
(6,499
)
—
Accrued dividends on Series E Preferred Stock ................................................... — (1,019
)
(3,000
)
(929
)
—
Accretion on Series D Preferred Stock ................................................................. (473) (473
)
(473
)
(148
)
—
Accretion on Series E Preferred Stock.................................................................. — (114
)
(339
)
(106
)
—
Net income applicable to Common Stock............................................................. $ 43,411 $ 176,065 $ 28,988 $ 92,721 $ 149,438
Net income per common share(1):
Net income per common share - basic ............................................................. $ 0.18 $ 0.71 $ 0.11 $ 0.29 $ 0.43
Net income per common share - diluted .......................................................... $ 0.15 $ 0.62 $ 0.10 $ 0.28 $ 0.42
Weighted average shares(1):
Basic ................................................................................................................. 126,722,051 135,352,396 155,820,381 287,692,280 349,395,285
Diluted .............................................................................................................. 150,633,686 153,610,589 159,696,608 296,337,724 355,380,111
Year Ended December 31,
2004 2005 2006 2007 2008
(In Thousands)
Other Financial Data:
Net cash provided by operating activities ............................................................ $ 150,379 $ 283,216 $ 364,761 $ 589,306 $ 447,490
Net cash used in investment activities ................................................................. (190,881) (905,228) (1,939,665) (517,088) (1,294,275)
Net cash (used in) provided by financing activities............................................. (5,433) 712,244 1,623,693 1,236,492 74,525
As of December 31,
2004 2005 2006 2007 2008
(In Thousands)
Balance Sheet Data:
Cash, cash equivalents & short-term investments ............................................... $ 59,441 $ 503,131 $ 552,149 $ 1,470,208 $ 697,948
Property and equipment, net................................................................................. 636,368 831,490 1,256,162 1,891,411 2,847,751
Total assets ........................................................................................................... 965,396 2,158,981 4,153,122 5,806,130 6,422,148
Long-term debt (including current maturities)..................................................... 184,999 905,554 2,596,000 3,002,177 3,074,992
Series D Cumulative Convertible Redeemable Participating Preferred Stock.... 400,410 421,889 443,368 — —
Series E Cumulative Convertible Redeemable Participating Preferred Stock .... — 47,796 51,135 — —
Stockholders’ equity............................................................................................. 125,434 367,906 413,245 1,848,746 2,034,323
_________________________________________
(1) See Note 19 to the consolidated financial statements included elsewhere in this report for an explanation of the calculation of basic and diluted net income per common share. The
calculation of basic and diluted net income per common share for the years ended December 31, 2004 and 2005 is not included in Note 19 to the consolidated financial statements.