Metro PCS 2008 Annual Report Download - page 145
Download and view the complete annual report
Please find page 145 of the 2008 Metro PCS annual report below. You can navigate through the pages in the report by either clicking on the pages listed below, or by using the keyword search tool below to find specific information within the annual report.-
 1
1 -
2
-
3
-
4
-
5
-
6
-
7
-
8
-
9
-
10
-
11
-
12
-
13
-
14
-
15
-
16
-
17
-
18
-
19
-
20
-
21
-
22
-
23
-
24
-
25
-
26
-
27
-
28
-
29
-
30
-
31
-
32
-
33
-
34
-
35
-
36
-
37
-
38
-
39
-
40
-
41
-
42
-
43
-
44
-
45
-
46
-
47
-
48
-
49
-
50
-
51
-
52
-
53
-
54
-
55
-
56
-
57
-
58
-
59
-
60
-
61
-
62
-
63
-
64
-
65
-
66
-
67
-
68
-
69
-
70
-
71
-
72
-
73
-
74
-
75
-
76
-
77
-
78
-
79
-
80
-
81
-
82
-
83
-
84
-
85
-
86
-
87
-
88
-
89
-
90
-
91
-
92
-
93
-
94
-
95
-
96
-
97
-
98
-
99
-
100
-
101
-
102
-
103
-
104
-
105
-
106
-
107
-
108
-
109
-
110
-
111
-
112
-
113
-
114
-
115
-
116
-
117
-
118
-
119
-
120
-
121
-
122
-
123
-
124
-
125
-
126
-
127
-
128
-
129
-
130
-
131
-
132
-
133
-
134
-
 135
135 -
 136
136 -
 137
137 -
 138
138 -
 139
139 -
 140
140 -
 141
141 -
 142
142 -
 143
143 -
 144
144 -
 145
145 -
 146
146 -
 147
147 -
 148
148 -
 149
149 -
 150
150 -
 151
151 -
 152
152
 |
 |

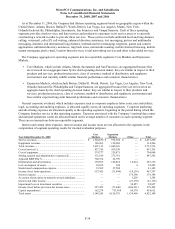
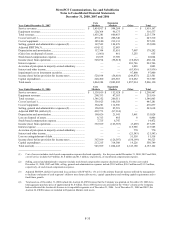
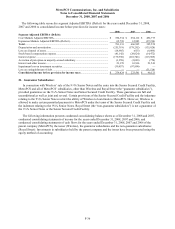
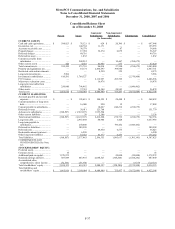
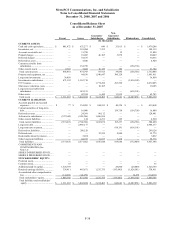
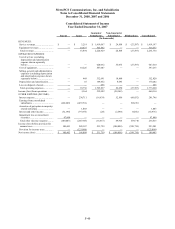
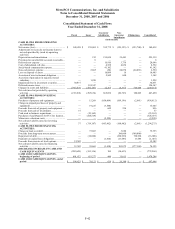
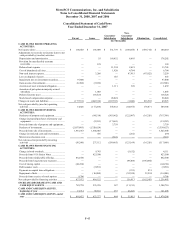
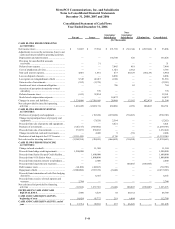
MetroPCS Communications, Inc. and Subsidiaries
Notes to Consolidated Financial Statements
December 31, 2008, 2007 and 2006
F-43
Consolidated Statement of Cash Flows
Year Ended December 31, 2007
Parent Issuer
Guarantor
Subsidiaries
Non-
Guarantor
Subsidiaries Elimination Consolidated
(In Thousands)
CASH FLOWS FROM OPERATING
ACTIVITIES:
Net income (loss) .................................................. $ 100,403 $ 166,009 $ 531,759 $ (108,058) $ (589,710) $ 100,403
Adjustments to reconcile net income (loss) to net
cash provided by (used in) activities:
Depreciation and amortization............................. — 55 169,452 8,695 — 178,202
Provision for uncollectible accounts
receivable ........................................................... — 129 — — — 129
Deferred rent expense .......................................... — — 11,324 2,421 — 13,745
Cost of abandoned cell sites................................. — — 1,920 4,784 — 6,704
Non-cash interest expense.................................... — 3,266 — 47,915 (47,922) 3,259
Loss on disposal of assets .................................... — — 655 — — 655
Impairment loss on investment securities............ 97,800 — — — — 97,800
Gain on sale of investments ................................. (6,586) (3,920) — — — (10,506)
Accretion of asset retirement obligation.............. — — 1,111 328 — 1,439
Accretion of put option in majority-owned
subsidiary ........................................................... — 1,003 — — — 1,003
Deferred income taxes ......................................... — 118,524 — — — 118,524
Stock-based compensation expense..................... — — 28,024 — — 28,024
Changes in assets and liabilities............................ (177,591) (402,354) (185,593) (1,040) 816,503 49,925
Net cash provided by (used in) operating
activities .............................................................. 14,026 (117,288) 558,652 (44,955) 178,871 589,306
CASH FLOWS FROM INVESTING
ACTIVITIES:
Purchases of property and equipment.................. — (84,514) (543,962) (122,907) (16,326) (767,709)
Change in prepaid purchases of property and
equipment........................................................... — (2,391) (17,601) — — (19,992)
Proceeds from sale of property and equipment ... — — 3,759 — — 3,759
Purchase of investments....................................... (2,037,803) (1,320,624) — — — (3,358,427)
Proceeds from sale of investments....................... 1,981,563 1,644,085 — — — 3,625,648
Change in restricted cash and investments .......... — 556 — (262) — 294
Microwave relocation costs ................................. — — (661) — — (661)
Net cash (used in) provided by investing
activities .............................................................. (56,240) 237,112 (558,465) (123,169) (16,326) (517,088)
CASH FLOWS FROM FINANCING
ACTIVITIES:
Change in book overdraft..................................... — 9,743 — (5,632) — 4,111
Proceeds from 9¼% Senior Notes ....................... — 423,500 — — — 423,500
Proceeds from initial public offering................... 862,500 — — — — 862,500
Proceeds from long-term note to parent .............. — — — 196,000 (196,000) —
Cost of raising capital .......................................... (44,234) — — — — (44,234)
Debt issuance costs .............................................. — (3,091) — — — (3,091)
Payments on capital lease obligations ................. — — — (931) 931 —
Repayment of debt ............................................... — (16,000) — (32,524) 32,524 (16,000)
Proceeds from exercise of stock options ............. 9,706 — — — — 9,706
Net cash provided by financing activities............. 827,972 414,152 — 156,913 (162,545) 1,236,492
INCREASE (DECREASE) IN CASH AND
CASH EQUIVALENTS ................................... 785,758 533,976 187 (11,211) — 1,308,710
CASH AND CASH EQUIVALENTS,
beginning of year............................................... 15,714 99,301 257 46,226 — 161,498
CASH AND CASH EQUIVALENTS, end of
year ..................................................................... $ 801,472 $ 633,277 $ 444 $ 35,015 $ — $ 1,470,208