Metro PCS 2008 Annual Report Download - page 106
Download and view the complete annual report
Please find page 106 of the 2008 Metro PCS annual report below. You can navigate through the pages in the report by either clicking on the pages listed below, or by using the keyword search tool below to find specific information within the annual report.-
 1
1 -
2
-
3
-
4
-
5
-
6
-
7
-
8
-
9
-
10
-
11
-
12
-
13
-
14
-
15
-
16
-
17
-
18
-
19
-
20
-
21
-
22
-
23
-
24
-
25
-
26
-
27
-
28
-
29
-
30
-
31
-
32
-
33
-
34
-
35
-
36
-
37
-
38
-
39
-
40
-
41
-
42
-
43
-
44
-
45
-
46
-
47
-
48
-
49
-
50
-
51
-
52
-
53
-
54
-
55
-
56
-
57
-
58
-
59
-
60
-
61
-
62
-
63
-
64
-
65
-
66
-
67
-
68
-
69
-
70
-
71
-
72
-
73
-
74
-
75
-
76
-
77
-
78
-
79
-
80
-
81
-
82
-
83
-
84
-
85
-
86
-
87
-
88
-
89
-
90
-
91
-
92
-
93
-
94
-
95
-
 96
96 -
 97
97 -
 98
98 -
 99
99 -
 100
100 -
 101
101 -
 102
102 -
 103
103 -
 104
104 -
 105
105 -
 106
106 -
 107
107 -
 108
108 -
 109
109 -
 110
110 -
 111
111 -
 112
112 -
 113
113 -
 114
114 -
 115
115 -
 116
116 -
117
-
118
-
119
-
120
-
121
-
122
-
123
-
124
-
125
-
126
-
127
-
128
-
129
-
130
-
131
-
132
-
133
-
134
-
135
-
136
-
137
-
138
-
139
-
140
-
141
-
142
-
143
-
144
-
145
-
146
-
147
-
148
-
149
-
150
-
151
-
152
 |
 |

F-4
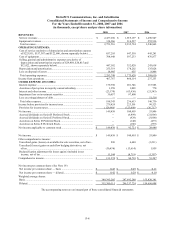
MetroPCS Communications, Inc. and Subsidiaries
Consolidated Statements of Income and Comprehensive Income
For the Years Ended December 31, 2008, 2007 and 2006
(in thousands, except share and per share information)
2008 2007 2006
REVENUES:
Service revenues .................................................................................. $ 2,437,250 $ 1,919,197 $ 1,290,947
Equipment revenues............................................................................. 314,266 316,537 255,916
Total revenues..................................................................................... 2,751,516 2,235,734 1,546,863
OPERATING EXPENSES:
Cost of service (exclusive of depreciation and amortization expense
of $225,911, $157,387 and $122,606, shown separately below) ....... 857,295 647,510 445,281
Cost of equipment................................................................................ 704,648 597,233 476,877
Selling, general and administrative expenses (exclusive of
depreciation and amortization expense of $29,408, $20,815 and
$12,422, shown separately below)..................................................... 447,582 352,020 243,618
Depreciation and amortization............................................................. 255,319 178,202 135,028
Loss on disposal of assets .................................................................... 18,905 655 8,806
Total operating expenses..................................................................... 2,283,749 1,775,620 1,309,610
Income from operations........................................................................ 467,767 460,114 237,253
OTHER EXPENSE (INCOME):
Interest expense ................................................................................... 179,398 201,746 115,985
Accretion of put option in majority-owned subsidiary......................... 1,258 1,003 770
Interest and other income..................................................................... (23,170) (63,936) (21,543)
Impairment loss on investment securities ............................................ 30,857 97,800
—
Loss on extinguishment of debt ........................................................... — — 51,518
Total other expense............................................................................. 188,343 236,613 146,730
Income before provision for income taxes............................................ 279,424 223,501 90,523
Provision for income taxes................................................................... (129,986) (123,098) (36,717)
Net income............................................................................................ 149,438 100,403 53,806
Accrued dividends on Series D Preferred Stock .................................. — (6,499) (21,006)
Accrued dividends on Series E Preferred Stock................................... — (929) (3,000)
Accretion on Series D Preferred Stock ................................................ — (148) (473)
Accretion on Series E Preferred Stock................................................. — (106) (339)
Net income applicable to common stock .............................................. $ 149,438 $ 92,721 $ 28,988
Net income............................................................................................ $ 149,438 $ 100,403 $ 53,806
Other comprehensive income:
Unrealized gains (losses) on available-for-sale securities, net of tax... 830 6,640 (1,211)
Unrealized (losses) gains on cash flow hedging derivatives, net
of tax.................................................................................................. (30,438) (13,614) 1,959
Reclassification adjustment for losses (gains) included in net
income, net of tax .............................................................................. 11,544 (8,719) (1,307)
Comprehensive income......................................................................... $ 131,374 $ 84,710 $ 53,247
Net income per common share: (See Note 19)
Net income per common share — basic .............................................. $ 0.43 $ 0.29 $ 0.11
Net income per common share — diluted............................................ $ 0.42 $ 0.28 $ 0.10
Weighted average shares:
Basic .................................................................................................... 349,395,285 287,692,280 155,820,381
Diluted ................................................................................................. 355,380,111 296,337,724 159,696,608
The accompanying notes are an integral part of these consolidated financial statements.