Metro PCS 2008 Annual Report Download - page 140
Download and view the complete annual report
Please find page 140 of the 2008 Metro PCS annual report below. You can navigate through the pages in the report by either clicking on the pages listed below, or by using the keyword search tool below to find specific information within the annual report.-
 1
1 -
2
-
3
-
4
-
5
-
6
-
7
-
8
-
9
-
10
-
11
-
12
-
13
-
14
-
15
-
16
-
17
-
18
-
19
-
20
-
21
-
22
-
23
-
24
-
25
-
26
-
27
-
28
-
29
-
30
-
31
-
32
-
33
-
34
-
35
-
36
-
37
-
38
-
39
-
40
-
41
-
42
-
43
-
44
-
45
-
46
-
47
-
48
-
49
-
50
-
51
-
52
-
53
-
54
-
55
-
56
-
57
-
58
-
59
-
60
-
61
-
62
-
63
-
64
-
65
-
66
-
67
-
68
-
69
-
70
-
71
-
72
-
73
-
74
-
75
-
76
-
77
-
78
-
79
-
80
-
81
-
82
-
83
-
84
-
85
-
86
-
87
-
88
-
89
-
90
-
91
-
92
-
93
-
94
-
95
-
96
-
97
-
98
-
99
-
100
-
101
-
102
-
103
-
104
-
105
-
106
-
107
-
108
-
109
-
110
-
111
-
112
-
113
-
114
-
115
-
116
-
117
-
118
-
119
-
120
-
121
-
122
-
123
-
124
-
125
-
126
-
127
-
128
-
129
-
 130
130 -
 131
131 -
 132
132 -
 133
133 -
 134
134 -
 135
135 -
 136
136 -
 137
137 -
 138
138 -
 139
139 -
 140
140 -
 141
141 -
 142
142 -
 143
143 -
 144
144 -
 145
145 -
 146
146 -
 147
147 -
 148
148 -
 149
149 -
 150
150 -
151
-
152
 |
 |

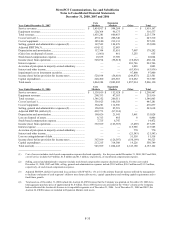
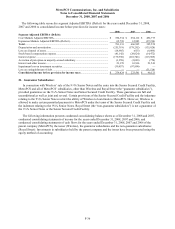
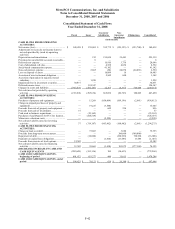
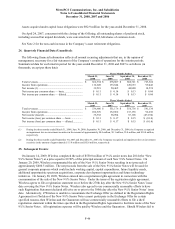
MetroPCS Communications, Inc. and Subsidiaries
Notes to Consolidated Financial Statements
December 31, 2008, 2007 and 2006
F-38
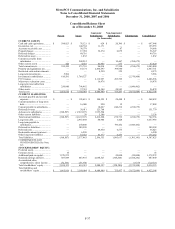
Consolidated Balance Sheet
As of December 31, 2007
Parent Issuer
Guarantor
Subsidiaries
Non-
Guarantor
Subsidiaries Eliminations Consolidated
(In thousands)
CURRENT ASSETS:
Cash and cash equivalents................. $ 801,472 $ 633,277 $ 444 $ 35,015 $ — $ 1,470,208
Inventories, net .................................. — 101,904 7,235 — — 109,139
Accounts receivable, net ................... — 31,790 — 19 — 31,809
Prepaid charges ................................. — 10,485 46,105 3,879 — 60,469
Deferred charges ............................... — 34,635 — — — 34,635
Deferred tax asset .............................. — 4,920 — — — 4,920
Current receivable from
subsidiaries...................................... — 154,758 — — (154,758) —
Other current assets ........................... 2,369 3,024 16,129 182 — 21,704
Total current assets........................... 803,841 974,793 69,913 39,095 (154,758) 1,732,884
Property and equipment, net ............. — 44,636 1,546,647 300,128 — 1,891,411
Long-term investments...................... 36,050 — — — — 36,050
Investment in subsidiaries ................. 471,392 1,362,710 — — (1,834,102) —
FCC licenses...................................... — — 1,779,296 293,599 — 2,072,895
Microwave relocation costs............... — — 10,105 — — 10,105
Long-term receivable from
subsidiaries...................................... — 618,191 — — (618,191) —
Other assets........................................ — 42,524 6,442 13,819 — 62,785
Total assets ....................................... $ 1,311,283 $ 3,042,854 $ 3,412,403 $ 646,641 $ (2,607,051) $ 5,806,130
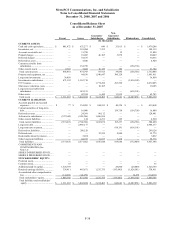
CURRENT LIABILITIES:
Accounts payable and accrued
expenses .......................................... $ 77 $ 154,205 $ 244,913 $ 40,254 $ — $ 439,449
Current maturities of long-term
debt.................................................. — 16,000 — 154,758 (154,758) 16,000
Deferred revenue............................... — 24,369 96,112 — — 120,481
Advances to subsidiaries................... (537,540) (949,296) 1,486,836 — — —
Other current liabilities ..................... — 124 4,211 225 — 4,560
Total current liabilities ..................... (537,463) (754,598) 1,832,072 195,237 (154,758) 580,490
Long-term debt.................................. — 2,986,177 — — — 2,986,177
Long-term note to parent................... — — — 618,191 (618,191) —
Deferred tax liabilities....................... — 290,128 — — — 290,128
Deferred rents .................................... — — 32,939 2,840 — 35,779
Redeemable minority interest ........... — 5,032 — — — 5,032
Other long-term liabilities ................. — 44,723 11,637 3,418 — 59,778
Total liabilities ................................. (537,463) 2,571,462 1,876,648 819,686 (772,949) 3,957,384
COMMITMENTS AND
CONTINGENCIES (See
Note 12)
SERIES D PREFERRED STOCK ..... — — — — — —
SERIES E PREFERRED STOCK ..... — — — — — —
STOCKHOLDERS’ EQUITY:
Preferred stock................................... — — — — — —
Common stock................................... 35 — — — — 35
Additional paid-in capital.................. 1,524,769 — — 20,000 (20,000) 1,524,769
Retained earnings (deficit) ................ 338,411 485,871 1,535,755 (193,045) (1,828,581) 338,411
Accumulated other comprehensive
loss .................................................. (14,469) (14,479) — — 14,479 (14,469)
Total stockholders’ equity................ 1,848,746 471,392 1,535,755 (173,045) (1,834,102) 1,848,746
Total liabilities and stockholders’
equity ............................................. $ 1,311,283 $ 3,042,854 $ 3,412,403 $ 646,641 $ (2,607,051) $ 5,806,130