Metro PCS 2008 Annual Report Download - page 75
Download and view the complete annual report
Please find page 75 of the 2008 Metro PCS annual report below. You can navigate through the pages in the report by either clicking on the pages listed below, or by using the keyword search tool below to find specific information within the annual report.-
 1
1 -
2
-
3
-
4
-
5
-
6
-
7
-
8
-
9
-
10
-
11
-
12
-
13
-
14
-
15
-
16
-
17
-
18
-
19
-
20
-
21
-
22
-
23
-
24
-
25
-
26
-
27
-
28
-
29
-
30
-
31
-
32
-
33
-
34
-
35
-
36
-
37
-
38
-
39
-
40
-
41
-
42
-
43
-
44
-
45
-
46
-
47
-
48
-
49
-
50
-
51
-
52
-
53
-
54
-
55
-
56
-
57
-
58
-
59
-
60
-
61
-
62
-
63
-
64
-
 65
65 -
 66
66 -
 67
67 -
 68
68 -
 69
69 -
 70
70 -
 71
71 -
 72
72 -
 73
73 -
 74
74 -
 75
75 -
 76
76 -
 77
77 -
 78
78 -
 79
79 -
 80
80 -
 81
81 -
 82
82 -
 83
83 -
 84
84 -
 85
85 -
86
-
87
-
88
-
89
-
90
-
91
-
92
-
93
-
94
-
95
-
96
-
97
-
98
-
99
-
100
-
101
-
102
-
103
-
104
-
105
-
106
-
107
-
108
-
109
-
110
-
111
-
112
-
113
-
114
-
115
-
116
-
117
-
118
-
119
-
120
-
121
-
122
-
123
-
124
-
125
-
126
-
127
-
128
-
129
-
130
-
131
-
132
-
133
-
134
-
135
-
136
-
137
-
138
-
139
-
140
-
141
-
142
-
143
-
144
-
145
-
146
-
147
-
148
-
149
-
150
-
151
-
152
 |
 |

66
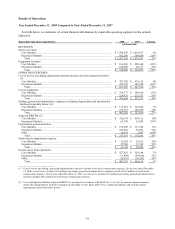
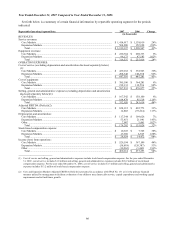
Year Ended December 31, 2007 Compared to Year Ended December 31, 2006
Set forth below is a summary of certain financial information by reportable operating segment for the periods
indicated:
Reportable Operating Segment Data 2007 2006 Change
(in thousands)
REVENUES:
Service revenues:
Core Markets ................................................................................................................ $ 1,414,917 $ 1,138,019 24%
Expansion Markets ....................................................................................................... 504,280 152,928 230%
Total ......................................................................................................................... $ 1,919,197 $ 1,290,947 49%
Equipment revenues:
Core Markets ................................................................................................................ $ 220,364 $ 208,333 6%
Expansion Markets ....................................................................................................... 96,173 47,583 102%
Total ......................................................................................................................... $ 316,537 $ 255,916 24%
OPERATING EXPENSES:
Cost of service (excluding depreciation and amortization disclosed separately below)
(1):
Core Markets ................................................................................................................ $ 439,162 $ 338,923 30%
Expansion Markets ....................................................................................................... 208,348 106,358 96%
Total ......................................................................................................................... $ 647,510 $ 445,281 45%
Cost of equipment:
Core Markets ................................................................................................................ $ 385,100 $ 364,281 6%
Expansion Markets ....................................................................................................... 212,133 112,596 88%
Total ......................................................................................................................... $ 597,233 $ 476,877 25%
Selling, general and administrative expenses (excluding depreciation and amortization
disclosed separately below)(1):
Core Markets ................................................................................................................ $ 167,542 $ 158,100 6%
Expansion Markets ....................................................................................................... 184,478 85,518 116%
Total ......................................................................................................................... $ 352,020 $ 243,618 44%
Adjusted EBITDA (Deficit)(2):
Core Markets ................................................................................................................ $ 654,112 $ 492,773 33%
Expansion Markets ....................................................................................................... 12,883 (97,214) 113%
Depreciation and amortization:
Core Markets ................................................................................................................ $ 117,344 $ 109,626 7%
Expansion Markets ....................................................................................................... 53,851 21,941 145%
Other............................................................................................................................. 7,007 3,461 102%
Total ......................................................................................................................... $ 178,202 $ 135,028 32%
Stock-based compensation expense:
Core Markets ................................................................................................................ $ 10,635 $ 7,725 38%
Expansion Markets ....................................................................................................... 17,389 6,747 158%
Total ......................................................................................................................... $ 28,024 $ 14,472 94%
Income (loss) from operations:
Core Markets ................................................................................................................ $ 529,194 $ 367,109 44%
Expansion Markets ....................................................................................................... (58,818) (126,387) 53%
Other............................................................................................................................. (10,262) (3,469) 196%
Total ......................................................................................................................... $ 460,114 $ 237,253 94%
_______________________
(1) Cost of service and selling, general and administrative expenses include stock-based compensation expense. For the year ended December
31, 2007, cost of service includes $1.8 million and selling, general and administrative expenses includes $26.2 million of stock-based
compensation expense. For the year ended December 31, 2006, cost of service includes $1.3 million and selling, general and administrative
expenses includes $13.2 million of stock-based compensation expense.
(2) Core and Expansion Markets Adjusted EBITDA (Deficit) is presented in accordance with SFAS No. 131 as it is the primary financial
measure utilized by management to facilitate evaluation of our ability to meet future debt service, capital expenditures and working capital
requirements and to fund future growth.