Metro PCS 2008 Annual Report Download - page 108
Download and view the complete annual report
Please find page 108 of the 2008 Metro PCS annual report below. You can navigate through the pages in the report by either clicking on the pages listed below, or by using the keyword search tool below to find specific information within the annual report.-
 1
1 -
2
-
3
-
4
-
5
-
6
-
7
-
8
-
9
-
10
-
11
-
12
-
13
-
14
-
15
-
16
-
17
-
18
-
19
-
20
-
21
-
22
-
23
-
24
-
25
-
26
-
27
-
28
-
29
-
30
-
31
-
32
-
33
-
34
-
35
-
36
-
37
-
38
-
39
-
40
-
41
-
42
-
43
-
44
-
45
-
46
-
47
-
48
-
49
-
50
-
51
-
52
-
53
-
54
-
55
-
56
-
57
-
58
-
59
-
60
-
61
-
62
-
63
-
64
-
65
-
66
-
67
-
68
-
69
-
70
-
71
-
72
-
73
-
74
-
75
-
76
-
77
-
78
-
79
-
80
-
81
-
82
-
83
-
84
-
85
-
86
-
87
-
88
-
89
-
90
-
91
-
92
-
93
-
94
-
95
-
96
-
97
-
 98
98 -
 99
99 -
 100
100 -
 101
101 -
 102
102 -
 103
103 -
 104
104 -
 105
105 -
 106
106 -
 107
107 -
 108
108 -
 109
109 -
 110
110 -
 111
111 -
 112
112 -
 113
113 -
 114
114 -
 115
115 -
 116
116 -
 117
117 -
 118
118 -
119
-
120
-
121
-
122
-
123
-
124
-
125
-
126
-
127
-
128
-
129
-
130
-
131
-
132
-
133
-
134
-
135
-
136
-
137
-
138
-
139
-
140
-
141
-
142
-
143
-
144
-
145
-
146
-
147
-
148
-
149
-
150
-
151
-
152
 |
 |

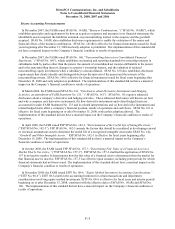
F-6
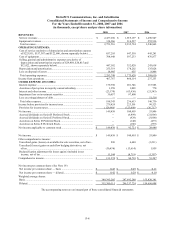
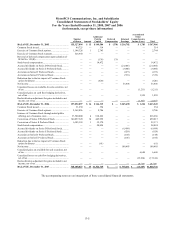
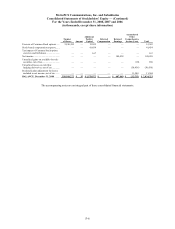
MetroPCS Communications, Inc. and Subsidiaries
Consolidated Statements of Stockholders’ Equity — (Continued)
For the Years Ended December 31, 2008, 2007 and 2006
(in thousands, except share information)
Number
of Shares Amount
Additional
Paid-In
Capital
Deferred
Compensation
Retained
Earnings
Accumulated
Other
Comprehensive
Income (Loss) Total
Exercise of Common Stock options ...... 2,810,245 — 12,582 — — — 12,582
Stock-based compensation expense....... — — 41,454 — — — 41,454
Tax impact of Common Stock option
exercises and forfeitures....................... — — 167 — — — 167
Net income ............................................. — — — — 149,438 — 149,438
Unrealized gains on available-for-sale
securities, net of tax.............................. — — — — — 830 830
Unrealized losses on cash flow
hedging derivatives, net of tax ............. — — — — — (30,438) (30,438)
Reclassification adjustment for losses
included in net income, net of tax ........ — — — — — 11,544 11,544
BALANCE, December 31, 2008 ......... 350,918,272 $ 35 $ 1,578,972 $ — $ 487,849 $ (32,533) $ 2,034,323
The accompanying notes are an integral part of these consolidated financial statements.