Metro PCS 2008 Annual Report Download - page 139
Download and view the complete annual report
Please find page 139 of the 2008 Metro PCS annual report below. You can navigate through the pages in the report by either clicking on the pages listed below, or by using the keyword search tool below to find specific information within the annual report.-
 1
1 -
2
-
3
-
4
-
5
-
6
-
7
-
8
-
9
-
10
-
11
-
12
-
13
-
14
-
15
-
16
-
17
-
18
-
19
-
20
-
21
-
22
-
23
-
24
-
25
-
26
-
27
-
28
-
29
-
30
-
31
-
32
-
33
-
34
-
35
-
36
-
37
-
38
-
39
-
40
-
41
-
42
-
43
-
44
-
45
-
46
-
47
-
48
-
49
-
50
-
51
-
52
-
53
-
54
-
55
-
56
-
57
-
58
-
59
-
60
-
61
-
62
-
63
-
64
-
65
-
66
-
67
-
68
-
69
-
70
-
71
-
72
-
73
-
74
-
75
-
76
-
77
-
78
-
79
-
80
-
81
-
82
-
83
-
84
-
85
-
86
-
87
-
88
-
89
-
90
-
91
-
92
-
93
-
94
-
95
-
96
-
97
-
98
-
99
-
100
-
101
-
102
-
103
-
104
-
105
-
106
-
107
-
108
-
109
-
110
-
111
-
112
-
113
-
114
-
115
-
116
-
117
-
118
-
119
-
120
-
121
-
122
-
123
-
124
-
125
-
126
-
127
-
128
-
 129
129 -
 130
130 -
 131
131 -
 132
132 -
 133
133 -
 134
134 -
 135
135 -
 136
136 -
 137
137 -
 138
138 -
 139
139 -
 140
140 -
 141
141 -
 142
142 -
 143
143 -
 144
144 -
 145
145 -
 146
146 -
 147
147 -
 148
148 -
 149
149 -
150
-
151
-
152
 |
 |

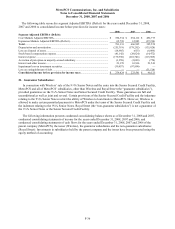
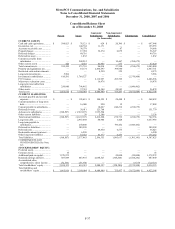
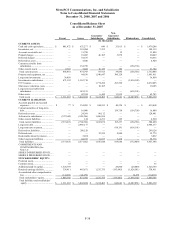
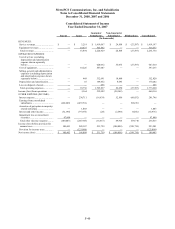
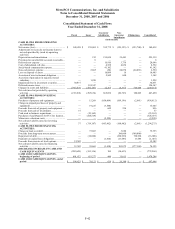
MetroPCS Communications, Inc. and Subsidiaries
Notes to Consolidated Financial Statements
December 31, 2008, 2007 and 2006
F-37
Consolidated Balance Sheet
As of December 31, 2008
Parent Issuer
Guarantor
Subsidiaries
Non-Guarantor
Subsidiaries Eliminations Consolidated
(in thousands)
CURRENT ASSETS:
Cash and cash equivalents............ $ 598,823 $ 78,121 $ 624 $ 20,380 $ — $ 697,948
Inventories, net ............................. — 144,784 11,171 — — 155,955
Accounts receivable, net .............. — 34,579 — 87 — 34,666
Prepaid charges ............................ — 17,994 32,274 6,079 — 56,347
Deferred charges .......................... — 49,716 — — — 49,716
Deferred tax asset ......................... — 1,832 — — — 1,832
Current receivable from
subsidiaries................................. — 244,212 — 10,467 (254,679) —
Other current assets ...................... 426 4,472 41,945 577 — 47,420
Total current assets....................... 599,249 575,710 86,014 37,590 (254,679) 1,043,884
Property and equipment, net........... — 18,174 2,430,597 398,980 — 2,847,751
Restricted cash and investments .. — — 4,250 325 — 4,575
Long-term investments................. 5,986 — — — — 5,986
Investment in subsidiaries ............ 610,581 1,760,327 — — (2,370,908) —
FCC licenses................................. — — 2,112,997 293,599 — 2,406,596
Microwave relocation costs.......... — — 16,478 — — 16,478
Long-term receivable from
subsidiaries................................. 250,000 796,462 — — (1,046,462) —
Other assets................................... — 37,391 34,544 24,943 — 96,878
Total assets ................................... $ 1,465,816 $ 3,188,064 $ 4,684,880 $ 755,437 $ (3,672,049) $ 6,422,148
CURRENT LIABILITIES:
Accounts payable and accrued
expenses ..................................... $ — $ 195,619 $ 344,325 $ 28,488 $ — $ 568,432
Current maturities of long-term
debt............................................. — 16,000 990 19 — 17,009
Current payable to subsidiaries .... — — 10,467 244,212 (254,679) —
Deferred revenue.......................... — 30,011 121,768 — — 151,779
Advances to subsidiaries .............. (568,507) (1,365,057) 1,933,564 — — —
Other current liabilities ................ — 30 5,106 — — 5,136
Total current liabilities ................. (568,507) (1,123,397) 2,416,220 272,719 (254,679) 742,356
Long-term debt............................. — 2,967,649 88,906 1,428 — 3,057,983
Long-term payable to
subsidiaries................................. — 250,000 — 796,462 (1,046,462) —
Deferred tax liabilities.................. — 389,509 — — — 389,509
Deferred rents ............................... — — 49,850 6,575 — 56,425
Redeemable minority interest ...... — 6,290 — — — 6,290
Other long-term liabilities ............ — 87,432 41,377 6,453 — 135,262
Total liabilities.............................. (568,507) 2,577,483 2,596,353 1,083,637 (1,301,141) 4,387,825
COMMITMENTS AND
CONTINGENCIES (See Note
12)
STOCKHOLDERS’ EQUITY:
Preferred stock.............................. — — — — — —
Common stock.............................. 35 — — — — 35
Additional paid-in capital............. 1,578,972 — — 20,000 (20,000) 1,578,972
Retained earnings (deficit) ........... 487,849 643,955 2,088,527 (348,200) (2,384,282) 487,849
Accumulated other
comprehensive (loss) income .... (32,533) (33,374) — — 33,374 (32,533)
Total stockholders’ equity............ 2,034,323 610,581 2,088,527 (328,200) (2,370,908) 2,034,323
Total liabilities and
stockholders’ equity................... $ 1,465,816 $ 3,188,064 $ 4,684,880 $ 755,437 $ (3,672,049) $ 6,422,148