Metro PCS 2008 Annual Report Download - page 68
Download and view the complete annual report
Please find page 68 of the 2008 Metro PCS annual report below. You can navigate through the pages in the report by either clicking on the pages listed below, or by using the keyword search tool below to find specific information within the annual report.-
 1
1 -
2
-
3
-
4
-
5
-
6
-
7
-
8
-
9
-
10
-
11
-
12
-
13
-
14
-
15
-
16
-
17
-
18
-
19
-
20
-
21
-
22
-
23
-
24
-
25
-
26
-
27
-
28
-
29
-
30
-
31
-
32
-
33
-
34
-
35
-
36
-
37
-
38
-
39
-
40
-
41
-
42
-
43
-
44
-
45
-
46
-
47
-
48
-
49
-
50
-
51
-
52
-
53
-
54
-
55
-
56
-
57
-
 58
58 -
 59
59 -
 60
60 -
 61
61 -
 62
62 -
 63
63 -
 64
64 -
 65
65 -
 66
66 -
 67
67 -
 68
68 -
 69
69 -
 70
70 -
 71
71 -
 72
72 -
 73
73 -
 74
74 -
 75
75 -
 76
76 -
 77
77 -
 78
78 -
79
-
80
-
81
-
82
-
83
-
84
-
85
-
86
-
87
-
88
-
89
-
90
-
91
-
92
-
93
-
94
-
95
-
96
-
97
-
98
-
99
-
100
-
101
-
102
-
103
-
104
-
105
-
106
-
107
-
108
-
109
-
110
-
111
-
112
-
113
-
114
-
115
-
116
-
117
-
118
-
119
-
120
-
121
-
122
-
123
-
124
-
125
-
126
-
127
-
128
-
129
-
130
-
131
-
132
-
133
-
134
-
135
-
136
-
137
-
138
-
139
-
140
-
141
-
142
-
143
-
144
-
145
-
146
-
147
-
148
-
149
-
150
-
151
-
152
 |
 |

59
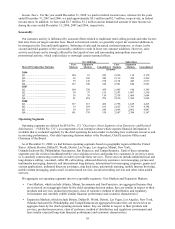
Income Taxes. For the year ended December 31, 2008, we paid no federal income taxes, whereas for the years
ended December 31, 2007 and 2006, we paid approximately $0.3 million and $2.7 million, respectively, in federal
income taxes. In addition, we have paid $2.7 million, $1.1 million and an immaterial amount of state income tax
during the years ended December 31, 2008, 2007 and 2006, respectively.
Seasonality
Our customer activity is influenced by seasonal effects related to traditional retail selling periods and other factors
that arise from our target customer base. Based on historical results, we generally expect net customer additions to
be strongest in the first and fourth quarters. Softening of sales and increased customer turnover, or churn, in the
second and third quarters of the year usually combine to result in fewer net customer additions. However, sales
activity and churn can be strongly affected by the launch of new and surrounding metropolitan areas and
promotional activity, which could reduce or outweigh certain seasonal effects.
Net Additions Subscribers
MetroPCS Subscriber Statistics
Core
Markets
Expansion
Markets Consolidated
Core
Markets
Expansion
Markets Consolidated
(In 000s)
2006
Q1............................................................ 184 61 245 2,056 114 2,170
Q2............................................................ 63 186 249 2,119 300 2,419
Q3............................................................ 55 143 198 2,174 443 2,617
Q4............................................................ 127 198 324 2,301 640 2,941
2007
Q1............................................................ 184 270 454 2,485 910 3,395
Q2............................................................ 58 97 155 2,543 1,007 3,550
Q3............................................................ 36 78 114 2,578 1,086 3,664
Q4............................................................ 81 218 299 2,659 1,304 3,963
2008
Q1............................................................ 137 315 452 2,796 1,619 4,415
Q2............................................................ 19 164 183 2,815 1,783 4,598
Q3............................................................ 30 219 249 2,846 2,001 4,847
Q4............................................................ 141 378 519 2,987 2,380 5,367
Operating Segments
Operating segments are defined by SFAS No. 131 “Disclosure About Segments of an Enterprise and Related
Information,” (“SFAS No. 131”), as components of an enterprise about which separate financial information is
available that is evaluated regularly by the chief operating decision maker in deciding how to allocate resources and
in assessing performance. Our chief operating decision maker is the President, Chief Executive Officer and
Chairman of the Board.
As of December 31, 2008, we had thirteen operating segments based on geographic region within the United
States: Atlanta, Boston, Dallas/Ft. Worth, Detroit, Las Vegas, Los Angeles, Miami, New York,
Orlando/Jacksonville, Philadelphia, Sacramento, San Francisco, and Tampa/Sarasota. Each of these operating
segments provide wireless broadband mobile voice and data services and products to customers in its service areas
or is currently constructing a network in order to provide these services. These services include unlimited local and
long distance calling, voicemail, caller ID, call waiting, enhanced directory assistance, text messaging, picture and
multimedia messaging, domestic and international long distance, international text messaging, ringtones, games and
content applications, unlimited directory assistance, ring back tones, nationwide roaming, mobile Internet browsing,
mobile instant messaging, push e-mail, location based services, social networking services and other value-added
services.
We aggregate our operating segments into two reportable segments: Core Markets and Expansion Markets.
•Core Markets, which include Atlanta, Miami, Sacramento and San Francisco, are aggregated because they
are reviewed on an aggregate basis by the chief operating decision maker, they are similar in respect to their
products and services, production processes, class of customer, method of distribution, and regulatory
environment and currently exhibit similar financial performance and economic characteristics.
•Expansion Markets, which include Boston, Dallas/Ft. Worth, Detroit, Las Vegas, Los Angeles, New York,
Orlando/Jacksonville, Philadelphia, and Tampa/Sarasota are aggregated because they are reviewed on an
aggregate basis by the chief operating decision maker, they are similar in respect to their products and
services, production processes, class of customer, method of distribution, and regulatory environment and
have similar expected long-term financial performance and economic characteristics.