Metro PCS 2008 Annual Report Download - page 73
Download and view the complete annual report
Please find page 73 of the 2008 Metro PCS annual report below. You can navigate through the pages in the report by either clicking on the pages listed below, or by using the keyword search tool below to find specific information within the annual report.-
 1
1 -
2
-
3
-
4
-
5
-
6
-
7
-
8
-
9
-
10
-
11
-
12
-
13
-
14
-
15
-
16
-
17
-
18
-
19
-
20
-
21
-
22
-
23
-
24
-
25
-
26
-
27
-
28
-
29
-
30
-
31
-
32
-
33
-
34
-
35
-
36
-
37
-
38
-
39
-
40
-
41
-
42
-
43
-
44
-
45
-
46
-
47
-
48
-
49
-
50
-
51
-
52
-
53
-
54
-
55
-
56
-
57
-
58
-
59
-
60
-
61
-
62
-
 63
63 -
 64
64 -
 65
65 -
 66
66 -
 67
67 -
 68
68 -
 69
69 -
 70
70 -
 71
71 -
 72
72 -
 73
73 -
 74
74 -
 75
75 -
 76
76 -
 77
77 -
 78
78 -
 79
79 -
 80
80 -
 81
81 -
 82
82 -
 83
83 -
84
-
85
-
86
-
87
-
88
-
89
-
90
-
91
-
92
-
93
-
94
-
95
-
96
-
97
-
98
-
99
-
100
-
101
-
102
-
103
-
104
-
105
-
106
-
107
-
108
-
109
-
110
-
111
-
112
-
113
-
114
-
115
-
116
-
117
-
118
-
119
-
120
-
121
-
122
-
123
-
124
-
125
-
126
-
127
-
128
-
129
-
130
-
131
-
132
-
133
-
134
-
135
-
136
-
137
-
138
-
139
-
140
-
141
-
142
-
143
-
144
-
145
-
146
-
147
-
148
-
149
-
150
-
151
-
152
 |
 |

64
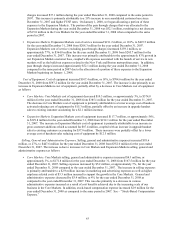
•Expansion Markets. Expansion Markets selling, general and administrative expenses increased $91.3 million,
or approximately 50%, to $275.8 million for the year ended December 31, 2008 from $184.5 million for the
year ended December 31, 2007. Selling expenses increased by $54.0 million, or 72%, for the year ended
December 31, 2008 compared to the year ended December 31, 2007. This increase is primarily due to a
$16.6 million increase in marketing and advertising expenses incurred to support the growth in the Expansion
Markets as well as higher employee related costs of $17.6 million to support the growth and buildout of the
Expansion Markets. General and administrative expenses increased by $27.7 million, or approximately 30%,
for the year ended December 31, 2008 compared to the same period in 2007 primarily due to the
approximately 83% growth in our Expansion Markets customer base, including the launch of service in new
markets, as well as the build-out expenses related to the New York and Boston metropolitan areas. In
addition, an increase of $10.2 million in stock-based compensation expense contributed to the increase in the
Expansion Markets. See – “Stock-Based Compensation Expense.”
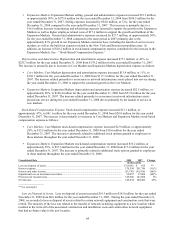
Depreciation and Amortization. Depreciation and amortization expense increased $77.1 million, or 43%, to
$255.3 million for the year ended December 31, 2008 from $178.2 million for the year ended December 31, 2007.
The increase is primarily due to increases in Core Markets and Expansion Markets depreciation expense as follows:
•Core Markets. Core Markets depreciation and amortization expense increased $13.4 million, or 11%, to
$130.7 million for the year ended December 31, 2008 from $117.3 million for the year ended December 31,
2007. The increase related primarily to an increase in network infrastructure assets placed into service during
the year ended December 31, 2008 to support the continued growth in the Core Markets.
•Expansion Markets. Expansion Markets depreciation and amortization expense increased $52.5 million, or
approximately 98%, to $106.4 million for the year ended December 31, 2008 from $53.9 million for the year
ended December 31, 2007. The increase related primarily to an increase in network infrastructure assets
placed into service during the year ended December 31, 2008 driven primarily by the launch of service in
new markets.
Stock-Based Compensation Expense. Stock-based compensation expense increased $13.1 million, or
approximately 47%, to $41.1 million for the year ended December 31, 2008 from $28.0 million for the year ended
December 31, 2007. The increase is due primarily to increases in Core Markets and Expansion Markets stock-based
compensation expense as follows:
•Core Markets. Core Markets stock-based compensation expense increased $2.9 million, or approximately
28%, to $13.5 million for the year ended December 31, 2008 from $10.6 million for the year ended
December 31, 2007. The increase is primarily related to additional stock options granted to employees in
these markets throughout the year ended December 31, 2008.
•Expansion Markets. Expansion Markets stock-based compensation expense increased $10.2 million, or
approximately 59%, to $27.6 million for the year ended December 31, 2008 from $17.4 million for the year
ended December 31, 2007. The increase is primarily related to additional stock options granted to employees
in these markets throughout the year ended December 31, 2008.
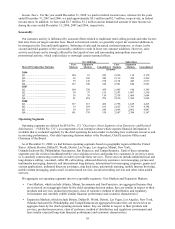
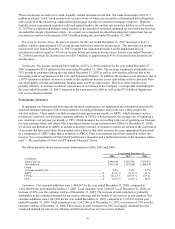
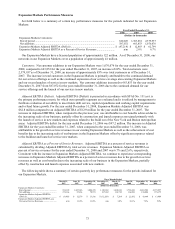
Consolidated Data 2008 2007 Change
(in thousands)
Loss on disposal of assets ................................................................................................................ $ 18,905 $ 655 **
Interest expense ............................................................................................................................... 179,398 201,746 (11)%
Interest and other income................................................................................................................. (23,170) (63,936) (64)%
Impairment loss on investment securities ........................................................................................ 30,857 97,800 (68)%
Provision for income taxes............................................................................................................... 129,986 123,098 6%
Net income....................................................................................................................................... 149,438 100,403 49%
_________________
** Not meaningful.
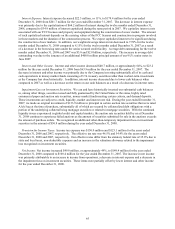
Loss on Disposal of Assets. Loss on disposal of assets increased $18.3 million to $18.9 million for the year ended
December 31, 2008 from $0.6 million for the year ended December 31, 2007. During the year ended December 31,
2008, we recorded a loss on disposal of assets related to certain network equipment and construction costs that were
retired. The majority of the loss was related to the transfer of network switching equipment to a new location which
resulted in the write-off of the associated construction and installation costs and certain other network equipment
that had no future value to the new location.