Metro PCS 2008 Annual Report Download - page 85
Download and view the complete annual report
Please find page 85 of the 2008 Metro PCS annual report below. You can navigate through the pages in the report by either clicking on the pages listed below, or by using the keyword search tool below to find specific information within the annual report.-
 1
1 -
2
-
3
-
4
-
5
-
6
-
7
-
8
-
9
-
10
-
11
-
12
-
13
-
14
-
15
-
16
-
17
-
18
-
19
-
20
-
21
-
22
-
23
-
24
-
25
-
26
-
27
-
28
-
29
-
30
-
31
-
32
-
33
-
34
-
35
-
36
-
37
-
38
-
39
-
40
-
41
-
42
-
43
-
44
-
45
-
46
-
47
-
48
-
49
-
50
-
51
-
52
-
53
-
54
-
55
-
56
-
57
-
58
-
59
-
60
-
61
-
62
-
63
-
64
-
65
-
66
-
67
-
68
-
69
-
70
-
71
-
72
-
73
-
74
-
 75
75 -
 76
76 -
 77
77 -
 78
78 -
 79
79 -
 80
80 -
 81
81 -
 82
82 -
 83
83 -
 84
84 -
 85
85 -
 86
86 -
 87
87 -
 88
88 -
 89
89 -
 90
90 -
 91
91 -
 92
92 -
 93
93 -
 94
94 -
 95
95 -
96
-
97
-
98
-
99
-
100
-
101
-
102
-
103
-
104
-
105
-
106
-
107
-
108
-
109
-
110
-
111
-
112
-
113
-
114
-
115
-
116
-
117
-
118
-
119
-
120
-
121
-
122
-
123
-
124
-
125
-
126
-
127
-
128
-
129
-
130
-
131
-
132
-
133
-
134
-
135
-
136
-
137
-
138
-
139
-
140
-
141
-
142
-
143
-
144
-
145
-
146
-
147
-
148
-
149
-
150
-
151
-
152
 |
 |

76
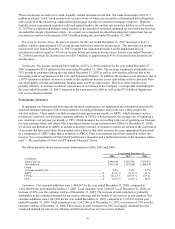
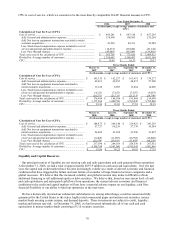
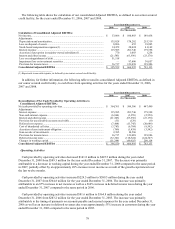
CPU to cost of service, which we consider to be the most directly comparable GAAP financial measure to CPU.
Year Ended December 31,
2006 2007 2008
(In thousands, except average number of customers and
CPU)
Calculation of Cost Per User (CPU):
Cost of service ........................................................................................ $ 445,281 $ 647,510 $ 857,295
Add: General and administrative expenses .......................................... 138,998 198,955 235,289
Add: Net loss on equipment transactions unrelated to initial
customer acquisition............................................................................ 41,538 49,331 95,282
Less: Stock-based compensation expense included in cost of
service and general and administrative expense .................................. (14,472) (28,024) (41,142)
Less: Pass through charges .................................................................. (45,640) (95,946) (136,801)
Total costs used in the calculation of CPU ............................................. $ 565,705 $ 771,826 $ 1,009,923
Divided by: Average number of customers ............................................ 2,398,682 3,508,497 4,631,168
CPU ........................................................................................................ $ 19.65 $ 18.33 $ 18.17
Three Months Ended
March 31,
2007
June 30,
2007
September 30,
2007
December 31,
2007
(In thousands, except average number of customers and CPU)
Calculation of Cost Per User (CPU):
Cost of service ......................................................................... $ 145,335 $ 162,227 $ 163,671 $ 176,277
Add: General and administrative expenses ........................... 42,831 49,352 48,871 57,900
Add: Net loss on equipment transactions unrelated to
initial customer acquisition................................................... 13,160 9,903 11,664 14,606
Less: Stock-based compensation expense included in cost
of service and general and administrative expense............... (4,211) (7,653) (7,107) (9,053)
Less: Pass through charges ................................................... (20,271) (25,721) (25,215) (24,740)
Total costs used in the calculation of CPU .............................. $ 176,844 $ 188,108 $ 191,884 $ 214,990
Divided by: Average number of customers ............................. 3,175,284 3,480,780 3,592,045 3,785,880
CPU ......................................................................................... $ 18.56 $ 18.01 $ 17.81 $ 18.93
Three Months Ended
March 31,
2008
June 30,
2008
September 30,
2008
December 31,
2008
(In thousands, except average number of customers and CPU)
Calculation of Cost Per User (CPU):
Cost of service ......................................................................... $ 188,473 $ 206,140 $ 219,423 $ 243,259
Add: General and administrative expenses ........................... 57,727 60,239 57,738 59,584
Add: Net loss on equipment transactions unrelated to
initial customer acquisition................................................... 26,409 21,380 23,596 23,897
Less: Stock-based compensation expense included in cost
of service and general and administrative expense............... (8,465) (11,007) (10,782) (10,888)
Less: Pass through charges ................................................... (26,554) (30,583) (31,445) (48,220)
Total costs used in the calculation of CPU .............................. $ 237,590 $ 246,169 $ 258,530 $ 267,632
Divided by: Average number of customers ............................. 4,198,794 4,501,980 4,741,043 5,082,856
CPU ......................................................................................... $ 18.86 $ 18.23 $ 18.18 $ 17.55
Liquidity and Capital Resources
Our principal sources of liquidity are our existing cash and cash equivalents and cash generated from operations.
At December 31, 2008, we had a total of approximately $697.9 million in cash and cash equivalents. Over the last
year, the capital and credit markets have become increasingly volatile as a result of adverse economic and financial
conditions that have triggered the failure and near failure of a number of large financial services companies and a
global recession. We believe that this increased volatility and global recession may make it difficult to obtain
additional financing or sell additional equity or debt securities. We believe that, based on our current level of cash
and cash equivalents and anticipated cash flows from operations, the current adverse economic and financial
conditions in the credit and capital markets will not have a material adverse impact on our liquidity, cash flow,
financial flexibility or our ability to fund our operations in the near-term.
We have historically invested our substantial cash balances in, among other things, securities issued and fully
guaranteed by the United States or the states, highly rated commercial paper and auction rate securities, money
market funds meeting certain criteria, and demand deposits. These investments are subject to credit, liquidity,
market and interest rate risk. At December 31, 2008, we had invested substantially all of our cash and cash
equivalents in money market funds consisting of U.S. treasury securities.