Metro PCS 2008 Annual Report Download - page 80
Download and view the complete annual report
Please find page 80 of the 2008 Metro PCS annual report below. You can navigate through the pages in the report by either clicking on the pages listed below, or by using the keyword search tool below to find specific information within the annual report.-
 1
1 -
2
-
3
-
4
-
5
-
6
-
7
-
8
-
9
-
10
-
11
-
12
-
13
-
14
-
15
-
16
-
17
-
18
-
19
-
20
-
21
-
22
-
23
-
24
-
25
-
26
-
27
-
28
-
29
-
30
-
31
-
32
-
33
-
34
-
35
-
36
-
37
-
38
-
39
-
40
-
41
-
42
-
43
-
44
-
45
-
46
-
47
-
48
-
49
-
50
-
51
-
52
-
53
-
54
-
55
-
56
-
57
-
58
-
59
-
60
-
61
-
62
-
63
-
64
-
65
-
66
-
67
-
68
-
69
-
 70
70 -
 71
71 -
 72
72 -
 73
73 -
 74
74 -
 75
75 -
 76
76 -
 77
77 -
 78
78 -
 79
79 -
 80
80 -
 81
81 -
 82
82 -
 83
83 -
 84
84 -
 85
85 -
 86
86 -
 87
87 -
 88
88 -
 89
89 -
 90
90 -
91
-
92
-
93
-
94
-
95
-
96
-
97
-
98
-
99
-
100
-
101
-
102
-
103
-
104
-
105
-
106
-
107
-
108
-
109
-
110
-
111
-
112
-
113
-
114
-
115
-
116
-
117
-
118
-
119
-
120
-
121
-
122
-
123
-
124
-
125
-
126
-
127
-
128
-
129
-
130
-
131
-
132
-
133
-
134
-
135
-
136
-
137
-
138
-
139
-
140
-
141
-
142
-
143
-
144
-
145
-
146
-
147
-
148
-
149
-
150
-
151
-
152
 |
 |

71
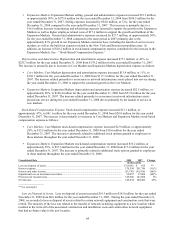
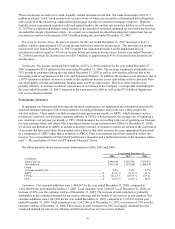
Churn. As we do not require a long-term service contract, our churn percentage is expected to be higher than
traditional wireless carriers that require customers to sign a one- to two-year contract with significant early
termination fees. Average monthly churn represents (a) the number of customers who have been disconnected from
our system during the measurement period less the number of customers who have reactivated service, divided by
(b) the sum of the average monthly number of customers during such period. We classify delinquent customers as
churn after they have been delinquent for 30 days. In addition, when an existing customer establishes a new account
in connection with the purchase of an upgraded or replacement phone and does not identify themselves as an
existing customer, we count the phone leaving service as a churn and the new phone entering service as a gross
customer addition. Churn remained flat for the year ended December 31, 2008 at 4.7%. Churn for the year ended
December 31, 2007 was 4.7% compared to 4.6% for the year ended December 31, 2006. The 0.1% increase in
churn was due to normal historical trends related to the maturity of our markets coupled with continued disconnects
from the significant increase in gross additions in the first quarter of 2007 compared to the first quarter of 2006. Our
customer activity is influenced by seasonal effects related to traditional retail selling periods and other factors that
arise from our target customer base. Based on historical results, we generally expect net customer additions to be
strongest in the first and fourth quarters. Softening of sales and increased churn in the second and third quarters of
the year usually combine to result in fewer net customer additions during these quarters. See – “Seasonality.”
Average Revenue Per User. ARPU represents (a) service revenues less pass through charges for the measurement
period, divided by (b) the sum of the average monthly number of customers during such period. ARPU was $41.39
and $43.31 for the years ended December 31, 2008 and 2007, respectively. The $1.92 decrease in ARPU was
primarily attributable to higher participation in our Family Plans as well as reduced revenue from certain features
included in our service plans that were previously provided a la carte. ARPU increased $0.05 during 2007 from
$43.26 for the year ended December 31, 2006. At December 31, 2008, approximately 80% of our customers were on
the $40 or higher rate plan.
Cost Per Gross Addition. CPGA is determined by dividing (a) selling expenses plus the total cost of equipment
associated with transactions with new customers less equipment revenues associated with transactions with new
customers during the measurement period by (b) gross customer additions during such period. Retail customer
service expenses and equipment margin on handsets sold to existing customers when they are identified, including
handset upgrade transactions, are excluded, as these costs are incurred specifically for existing customers. CPGA
has decreased to $127.21 for the year ended December 31, 2008 from $127.97 for the year ended December 31,
2007, which was primarily driven by a 33% increase in gross additions, partially offset by an increase in selling
expenses associated with the continued customer growth in our Expansion Markets and the launch of service in new
markets. CPGA increased to $127.97 for the year ended December 31, 2007 from $121.12 for the year ended
December 31, 2006, which was primarily driven by the selling expenses and equipment subsidy associated with the
customer growth in our Expansion Markets as well as selling expenses associated with the launch of service in new
markets.
Cost Per User. CPU is cost of service and general and administrative costs (excluding applicable non-cash stock-
based compensation expense included in cost of service and general and administrative expense) plus net loss on
handset equipment transactions unrelated to initial customer acquisition, divided by the sum of the average monthly
number of customers during such period. CPU for the years ended December 31, 2008 and 2007 was $18.17 and
$18.33, respectively. CPU for the year ended December 31, 2006 was $19.65. We continue to achieve cost benefits
due to the increasing scale of our business. However, these benefits have been partially offset by a combination of
the construction and launch expenses associated with our Expansion Markets, which contributed approximately
$3.91, $3.36 and $3.42 of additional CPU for the years ended December 31, 2008, 2007 and 2006, respectively.
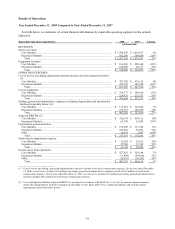
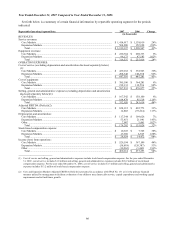
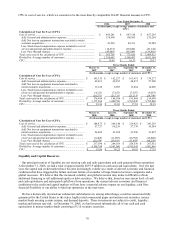
The following table shows consolidated quarterly metric information for the years ended December 31, 2007 and
2008.
Three Months Ended
March 31,
2007
June 30,
2007
September 30,
2007
December 31,
2007
March 31,
2008
June 30,
2008
September 30,
2008
December 31,
2008
Customers:..............
End of period.......... 3,395,203 3,549,916 3,664,218 3,962,786 4,414,519 4,598,049 4,847,314 5,366,833
Net additions........... 454,217 154,713 114,302 298,568 451,733 183,530 249,265 519,519
Churn:.....................
Average monthly
rate ....................... 4.0% 4.8% 5.2% 4.8% 4.0% 4.5% 4.8% 5.1%
ARPU ..................... $ 44.01 $ 43.44 $ 43.05 $ 42.83 $ 42.51 $ 42.05 $ 40.73 $ 40.52
CPGA ..................... $ 111.75 $ 128.86 $ 130.38 $ 141.42 $ 125.00 $ 140.82 $ 128.21 $ 119.82
CPU ........................ $ 18.56 $ 18.01 $ 17.81 $ 18.93 $ 18.86 $ 18.23 $ 18.18 $ 17.55