Metro PCS 2008 Annual Report Download - page 84
Download and view the complete annual report
Please find page 84 of the 2008 Metro PCS annual report below. You can navigate through the pages in the report by either clicking on the pages listed below, or by using the keyword search tool below to find specific information within the annual report.-
 1
1 -
2
-
3
-
4
-
5
-
6
-
7
-
8
-
9
-
10
-
11
-
12
-
13
-
14
-
15
-
16
-
17
-
18
-
19
-
20
-
21
-
22
-
23
-
24
-
25
-
26
-
27
-
28
-
29
-
30
-
31
-
32
-
33
-
34
-
35
-
36
-
37
-
38
-
39
-
40
-
41
-
42
-
43
-
44
-
45
-
46
-
47
-
48
-
49
-
50
-
51
-
52
-
53
-
54
-
55
-
56
-
57
-
58
-
59
-
60
-
61
-
62
-
63
-
64
-
65
-
66
-
67
-
68
-
69
-
70
-
71
-
72
-
73
-
 74
74 -
 75
75 -
 76
76 -
 77
77 -
 78
78 -
 79
79 -
 80
80 -
 81
81 -
 82
82 -
 83
83 -
 84
84 -
 85
85 -
 86
86 -
 87
87 -
 88
88 -
 89
89 -
 90
90 -
 91
91 -
 92
92 -
 93
93 -
 94
94 -
95
-
96
-
97
-
98
-
99
-
100
-
101
-
102
-
103
-
104
-
105
-
106
-
107
-
108
-
109
-
110
-
111
-
112
-
113
-
114
-
115
-
116
-
117
-
118
-
119
-
120
-
121
-
122
-
123
-
124
-
125
-
126
-
127
-
128
-
129
-
130
-
131
-
132
-
133
-
134
-
135
-
136
-
137
-
138
-
139
-
140
-
141
-
142
-
143
-
144
-
145
-
146
-
147
-
148
-
149
-
150
-
151
-
152
 |
 |

75
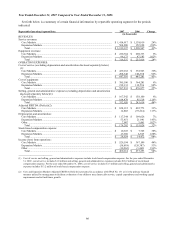
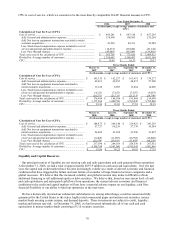
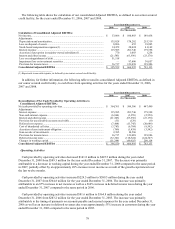
CPGA — We utilize CPGA to assess the efficiency of our distribution strategy, validate the initial capital
invested in our customers and determine the number of months to recover our customer acquisition costs. This
measure also allows us to compare our average acquisition costs per new customer to those of other wireless
broadband mobile providers. Equipment revenues related to new customers are deducted from selling expenses in
this calculation as they represent amounts paid by customers at the time their service is activated that reduce our
acquisition cost of those customers. Additionally, equipment costs associated with existing customers, net of related
revenues, are excluded as this measure is intended to reflect only the acquisition costs related to new customers.
The following table reconciles total costs used in the calculation of CPGA to selling expenses, which we consider to
be the most directly comparable GAAP financial measure to CPGA.
Year Ended December 31,
2006 2007 2008
(In thousands, except gross customer additions and
CPGA)
Calculation of Cost Per Gross Addition (CPGA):
Selling expenses .........................................................................................
.
$ 104,620 $ 153,065 $ 212,293
Less: Equipment revenues .......................................................................
.
(255,916) (316,537) (314,266)
Add: Equipment revenue not associated with new customers .................
.
114,392 142,822 149,029
Add: Cost of equipment...........................................................................
.
476,877 597,233 704,648
Less: Equipment costs not associated with new customers .....................
.
(155,930) (192,153) (244,311)
Gross addition expenses..............................................................................
.
$ 284,043 $ 384,430 $ 507,393
Divided by: Gross customer additions........................................................
.
2,345,135 3,004,177 3,988,692
CPGA .........................................................................................................
.
$ 121.12 $ 127.97 $ 127.21
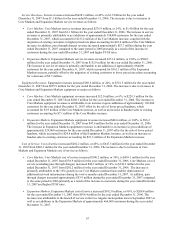
Three Months Ended
March 31,
2007
June 30,
2007
September 30,
2007
December 31,
2007
(In thousands, except gross customer additions and CPGA)
Calculation of Cost Per Gross Addition (CPGA):
Selling expenses ...................................................................... $ 30,106 $ 33,365 $ 35,625 $ 53,969
Less: Equipment revenues .................................................... (97,170) (71,835) (67,607) (79,925)
Add: Equipment revenue not associated with new
customers............................................................................ 42,009 33,892 31,590 35,330
Add: Cost of equipment........................................................ 173,308 133,439 131,179 159,308
Less: Equipment costs not associated with new
customers............................................................................ (55,169) (43,795) (43,254) (49,936)
Gross addition expenses........................................................... $ 93,084 $ 85,066 $ 87,533 $ 118,746
Divided by: Gross customer additions..................................... 832,983 660,149 671,379 839,666
CPGA ...................................................................................... $ 111.75 $ 128.86 $ 130.38 $ 141.42
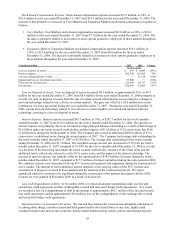
Three Months Ended
March 31,
2008
June 30,
2008
September 30,
2008
December 31,
2008
(In thousands, except gross customer additions and CPGA)
Calculation of Cost Per Gross Addition (CPGA):
Selling expenses .......................................................................... $ 46,647 $ 53,180 $ 58,916 $ 53,551
Less: Equipment revenues ........................................................ (100,384) (80,245) (76,030) (57,606)
Add: Equipment revenue not associated with new
customers................................................................................ 45,803 37,613 33,295 32,318
Add: Cost of equipment............................................................ 200,158 160,088 160,538 183,864
Less: Equipment costs not associated with new customers ...... (72,212) (58,993) (56,891) (56,215)
Gross addition expenses............................................................... $ 120,012 $ 111,643 $ 119,828 $ 155,912
Divided by: Gross customer additions......................................... 960,083 792,823 934,607 1,301,179
CPGA .......................................................................................... $ 125.00 $ 140.82 $ 128.21 $ 119.82
CPU — CPU is cost of service and general and administrative costs (excluding applicable non-cash stock-based
compensation expense included in cost of service and general and administrative expenses) plus net loss on
equipment transactions unrelated to initial customer acquisition exclusive of pass through charges, divided by the
sum of the average monthly number of customers during such period. CPU does not include any depreciation and
amortization expense. Management uses CPU as a tool to evaluate the non-selling cash expenses associated with
ongoing business operations on a per customer basis, to track changes in these non-selling cash costs over time, and
to help evaluate how changes in our business operations affect non-selling cash costs per customer. In addition, CPU
provides management with a useful measure to compare our non-selling cash costs per customer with those of other
wireless providers. We believe investors use CPU primarily as a tool to track changes in our non-selling cash costs
over time and to compare our non-selling cash costs to those of other wireless providers, although other wireless
carriers may calculate this measure differently. The following table reconciles total costs used in the calculation of