Metro PCS 2008 Annual Report Download - page 78
Download and view the complete annual report
Please find page 78 of the 2008 Metro PCS annual report below. You can navigate through the pages in the report by either clicking on the pages listed below, or by using the keyword search tool below to find specific information within the annual report.-
 1
1 -
2
-
3
-
4
-
5
-
6
-
7
-
8
-
9
-
10
-
11
-
12
-
13
-
14
-
15
-
16
-
17
-
18
-
19
-
20
-
21
-
22
-
23
-
24
-
25
-
26
-
27
-
28
-
29
-
30
-
31
-
32
-
33
-
34
-
35
-
36
-
37
-
38
-
39
-
40
-
41
-
42
-
43
-
44
-
45
-
46
-
47
-
48
-
49
-
50
-
51
-
52
-
53
-
54
-
55
-
56
-
57
-
58
-
59
-
60
-
61
-
62
-
63
-
64
-
65
-
66
-
67
-
 68
68 -
 69
69 -
 70
70 -
 71
71 -
 72
72 -
 73
73 -
 74
74 -
 75
75 -
 76
76 -
 77
77 -
 78
78 -
 79
79 -
 80
80 -
 81
81 -
 82
82 -
 83
83 -
 84
84 -
 85
85 -
 86
86 -
 87
87 -
 88
88 -
89
-
90
-
91
-
92
-
93
-
94
-
95
-
96
-
97
-
98
-
99
-
100
-
101
-
102
-
103
-
104
-
105
-
106
-
107
-
108
-
109
-
110
-
111
-
112
-
113
-
114
-
115
-
116
-
117
-
118
-
119
-
120
-
121
-
122
-
123
-
124
-
125
-
126
-
127
-
128
-
129
-
130
-
131
-
132
-
133
-
134
-
135
-
136
-
137
-
138
-
139
-
140
-
141
-
142
-
143
-
144
-
145
-
146
-
147
-
148
-
149
-
150
-
151
-
152
 |
 |

69
Stock-Based Compensation Expense. Stock-based compensation expense increased $13.5 million, or 94%, to
$28.0 million for the year ended December 31, 2007 from $14.5 million for the year ended December 31, 2006. The
increase is due primarily to increases in Core Markets and Expansion Markets stock-based compensation expense as
follows:
•Core Markets. Core Markets stock-based compensation expense increased $2.9 million, or 38%, to $10.6
million for the year ended December 31, 2007 from $7.7 million for the year ended December 31, 2006. The
increase is primarily related to an increase in stock options granted to employees in these markets throughout
the year ended December 31, 2007.
•Expansion Markets. Expansion Markets stock-based compensation expense increased $10.6 million, or
158%, to $17.4 million for the year ended December 31, 2007 from $6.8 million for the year ended
December 31, 2006. The increase is primarily related to an increase in stock options granted to employees in
these markets throughout the year ended December 31, 2007.
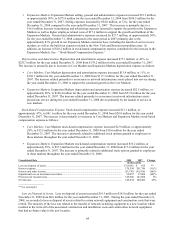
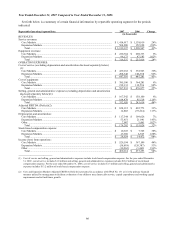
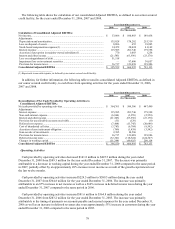
Consolidated Data 2007 2006 Change
(in thousands)
Loss on disposal of assets ................................................................................................................ $ 655 $ 8,806 (93)%
Interest expense ............................................................................................................................... 201,746 115,985 74%
Loss on extinguishment of debt ....................................................................................................... — 51,518 100%
Impairment loss on investment securities ........................................................................................ 97,800
— 100%
Provision for income taxes............................................................................................................... 123,098 36,717 235%
Net income....................................................................................................................................... 100,403 53,806 87%
Loss on Disposal of Assets. Loss on disposal of assets decreased $8.1 million, or approximately 93%, to $0.7
million for the year ended December 31, 2007 from $8.8 million for the year ended December 31, 2006 primarily as
a result of a gain on disposal of assets from the sale of certain network infrastructure assets related to a change in
network technology related to our cell sites in certain markets. The gain was offset by a $3.0 million loss on the
termination of a lease agreement during the year ended December 31, 2007. During the year ended December 31,
2006, certain network technology related to our cell sites in certain markets was retired and replaced with new
technology, resulting in a loss on disposal of assets.
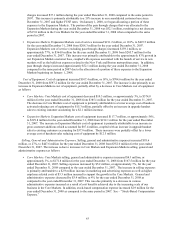
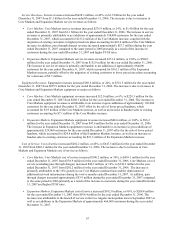
Interest Expense. Interest expense increased $85.7 million, or 74%, to $201.7 million for the twelve months
ended December 31, 2007 from $116.0 million for the twelve months ended December 31, 2006. The increase in
interest expense was primarily due to an increased average principal balance outstanding as a result of borrowings of
$1.6 billion under our senior secured credit facility and the issuance of $1.0 billion of 9¼% senior notes due 2014,
or initial notes, during the fourth quarter of 2006. The Company also issued an additional $400.0 million of 9¼%
senior notes, or additional notes, during the second quarter of 2007. The Company had average debt outstanding for
the twelve months ended December 31, 2007 of $2.8 billion. The average debt outstanding for the twelve months
ending December 31, 2006 was $1.3 billion. The weighted average interest rate decreased to 8.15% for the twelve
months ended December 31, 2007 compared to 10.30% for the twelve months ended December 31, 2006 as a result
of a decrease in the borrowing rates under the senior secured credit facility, issuance of the initial notes and the
additional notes, collectively referred to as the 9¼% senior notes, and the impact of the interest rate hedge. The
increase in interest expense was partially offset by the capitalization of $34.9 million of interest during the twelve
months ended December 31, 2007, compared to $17.5 million of interest capitalized during the same period in 2006.
We capitalize interest costs associated with our FCC licenses and property and equipment during the construction of
a new market. The amount of such capitalized interest depends on the carrying values of the FCC licenses and
construction in progress involved in those markets and the duration of the construction process. We expect
capitalized interest to continue to be significant during the construction of the markets associated with the AWS
licenses we were granted in November 2006 as a result of Auction 66.
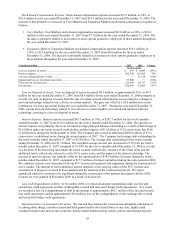
Loss on Extinguishment of Debt. In November 2006, we repaid all amounts outstanding under our first and
second lien credit agreements and the exchangeable secured and unsecured bridge credit agreements. As a result,
we recorded a loss on extinguishment of debt in the amount of approximately $42.7 million of the first and second
lien credit agreements and an approximately $9.4 million loss on the extinguishment of the exchangeable secured
and unsecured bridge credit agreements.
Impairment Loss on Investment Securities. We can and have historically invested our substantial cash balances
in, among other things, securities issued and fully guaranteed by the United States or any state, highly rated
commercial paper and auction rate securities, money market funds meeting certain criteria, and demand deposits.