Metro PCS 2008 Annual Report Download - page 136
Download and view the complete annual report
Please find page 136 of the 2008 Metro PCS annual report below. You can navigate through the pages in the report by either clicking on the pages listed below, or by using the keyword search tool below to find specific information within the annual report.-
 1
1 -
2
-
3
-
4
-
5
-
6
-
7
-
8
-
9
-
10
-
11
-
12
-
13
-
14
-
15
-
16
-
17
-
18
-
19
-
20
-
21
-
22
-
23
-
24
-
25
-
26
-
27
-
28
-
29
-
30
-
31
-
32
-
33
-
34
-
35
-
36
-
37
-
38
-
39
-
40
-
41
-
42
-
43
-
44
-
45
-
46
-
47
-
48
-
49
-
50
-
51
-
52
-
53
-
54
-
55
-
56
-
57
-
58
-
59
-
60
-
61
-
62
-
63
-
64
-
65
-
66
-
67
-
68
-
69
-
70
-
71
-
72
-
73
-
74
-
75
-
76
-
77
-
78
-
79
-
80
-
81
-
82
-
83
-
84
-
85
-
86
-
87
-
88
-
89
-
90
-
91
-
92
-
93
-
94
-
95
-
96
-
97
-
98
-
99
-
100
-
101
-
102
-
103
-
104
-
105
-
106
-
107
-
108
-
109
-
110
-
111
-
112
-
113
-
114
-
115
-
116
-
117
-
118
-
119
-
120
-
121
-
122
-
123
-
124
-
125
-
 126
126 -
 127
127 -
 128
128 -
 129
129 -
 130
130 -
 131
131 -
 132
132 -
 133
133 -
 134
134 -
 135
135 -
 136
136 -
 137
137 -
 138
138 -
 139
139 -
 140
140 -
 141
141 -
 142
142 -
 143
143 -
 144
144 -
 145
145 -
 146
146 -
147
-
148
-
149
-
150
-
151
-
152
 |
 |

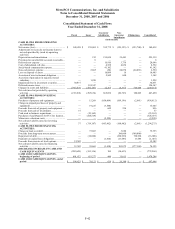
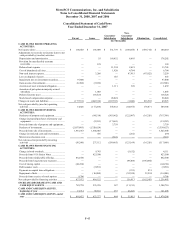
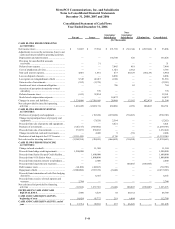
MetroPCS Communications, Inc. and Subsidiaries
Notes to Consolidated Financial Statements
December 31, 2008, 2007 and 2006
F-34
As of December 31, 2008, the Company had thirteen operating segments based on geographic region within the
United States: Atlanta, Boston, Dallas/Ft. Worth, Detroit, Las Vegas, Los Angeles, Miami, New York,
Orlando/Jacksonville, Philadelphia, Sacramento, San Francisco and Tampa/Sarasota. Each of these operating
segments provides wireless voice and data services and products to customers in its service areas or is currently
constructing a network in order to provide these services. These services include unlimited local and long distance
calling, voicemail, caller ID, call waiting, enhanced directory assistance, text messaging, picture and multimedia
messaging, domestic and international long distance, international text messaging, ringtones, games and content
applications, unlimited directory assistance, ring back tones, nationwide roaming, mobile Internet browsing, mobile
instant messaging, push e-mail, location based services, social networking services and other value-added services.
The Company aggregates its operating segments into two reportable segments: Core Markets and Expansion
Markets.
•Core Markets, which include Atlanta, Miami, Sacramento and San Francisco, are aggregated because they
are reviewed on an aggregate basis by the chief operating decision maker, they are similar in respect to their
products and services, production processes, class of customer, method of distribution, and regulatory
environment and currently exhibit similar financial performance and economic characteristics.
•Expansion Markets, which include Boston, Dallas/Ft. Worth, Detroit, Las Vegas, Los Angeles, New York,
Orlando/Jacksonville, Philadelphia and Tampa/Sarasota, are aggregated because they are reviewed on an
aggregate basis by the chief operating decision maker, they are similar in respect to their products and
services, production processes, class of customer, method of distribution, and regulatory environment and
have similar expected long-term financial performance and economic characteristics.
General corporate overhead, which includes expenses such as corporate employee labor costs, rent and utilities,
legal, accounting and auditing expenses, is allocated equally across all operating segments. Corporate marketing
and advertising expenses are allocated equally to the operating segments, beginning in the period during which the
Company launches service in that operating segment. Expenses associated with the Company’s national data center
and national operations center are allocated based on the average number of customers in each operating segment.
There are no transactions between reportable segments.
Interest and certain other expenses, interest income and income taxes are not allocated to the segments in the
computation of segment operating results for internal evaluation purposes.
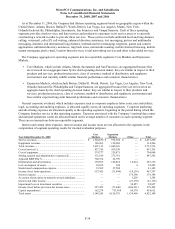
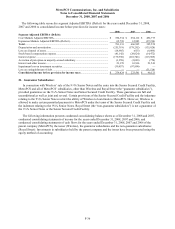
Year Ended December 31, 2008
Core
Markets
Expansion
Markets Other Total
Service revenues ....................................................................... $ 1,504,870 $ 932,380 $ — $ 2,437,250
Equipment revenues.................................................................. 186,263 128,003 — 314,266
Total revenues........................................................................... 1,691,133 1,060,383 — 2,751,516
Cost of service(1)...................................................................... 437,765 419,530 — 857,295
Cost of equipment..................................................................... 374,777 329,871 — 704,648
Selling, general and administrative expenses(2)....................... 171,819 275,763 — 447,582
Adjusted EBITDA(3)................................................................ 720,334 62,799 —
Depreciation and amortization.................................................. 130,695 106,410 18,214 255,319
Loss on disposal of assets ......................................................... 18,652 249 4 18,905
Stock-based compensation expense.......................................... 13,562 27,580 — 41,142
Income (loss) from operations .................................................. 557,425 (71,440) (18,218) 467,767
Interest expense ........................................................................ — — 179,398 179,398
Accretion of put option in majority-owned subsidiary.............. — — 1,258 1,258
Interest and other income.......................................................... — — (23,170) (23,170)
Impairment loss on investment securities ................................. — — 30,857 30,857
Income (loss) before provision for income taxes...................... 557,425 (71,440) (206,561) 279,424
Capital expenditures ................................................................. 162,274 731,968 60,370 954,612
Total assets ............................................................................... 1,140,205 4,126,975 1,154,968 6,422,148