Metro PCS 2008 Annual Report Download - page 82
Download and view the complete annual report
Please find page 82 of the 2008 Metro PCS annual report below. You can navigate through the pages in the report by either clicking on the pages listed below, or by using the keyword search tool below to find specific information within the annual report.-
 1
1 -
2
-
3
-
4
-
5
-
6
-
7
-
8
-
9
-
10
-
11
-
12
-
13
-
14
-
15
-
16
-
17
-
18
-
19
-
20
-
21
-
22
-
23
-
24
-
25
-
26
-
27
-
28
-
29
-
30
-
31
-
32
-
33
-
34
-
35
-
36
-
37
-
38
-
39
-
40
-
41
-
42
-
43
-
44
-
45
-
46
-
47
-
48
-
49
-
50
-
51
-
52
-
53
-
54
-
55
-
56
-
57
-
58
-
59
-
60
-
61
-
62
-
63
-
64
-
65
-
66
-
67
-
68
-
69
-
70
-
71
-
 72
72 -
 73
73 -
 74
74 -
 75
75 -
 76
76 -
 77
77 -
 78
78 -
 79
79 -
 80
80 -
 81
81 -
 82
82 -
 83
83 -
 84
84 -
 85
85 -
 86
86 -
 87
87 -
 88
88 -
 89
89 -
 90
90 -
 91
91 -
 92
92 -
93
-
94
-
95
-
96
-
97
-
98
-
99
-
100
-
101
-
102
-
103
-
104
-
105
-
106
-
107
-
108
-
109
-
110
-
111
-
112
-
113
-
114
-
115
-
116
-
117
-
118
-
119
-
120
-
121
-
122
-
123
-
124
-
125
-
126
-
127
-
128
-
129
-
130
-
131
-
132
-
133
-
134
-
135
-
136
-
137
-
138
-
139
-
140
-
141
-
142
-
143
-
144
-
145
-
146
-
147
-
148
-
149
-
150
-
151
-
152
 |
 |

73
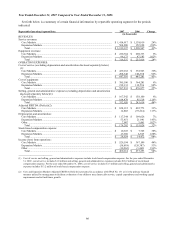
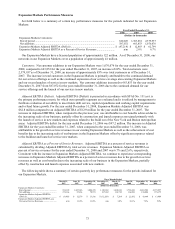
Expansion Markets Performance Measures
Set forth below is a summary of certain key performance measures for the periods indicated for our Expansion
Markets:
Year Ended December 31,
2006 2007 2008
(Dollars in thousands)
Expansion Markets Customers:
End of period ......................................................................................................................
.
640,028 1,303,881 2,379,957
Net additions.......................................................................................................................
.
587,072 663,853 1,076,076
Expansion Markets Adjusted EBITDA (Deficit) .................................................................
.
$ (97,214) $ 12,883 $ 62,799
Expansion Markets Adjusted EBITDA as a Percent of Service Revenues ..........................
.
n/m 2.6% 6.7%
Our Expansion Markets have a licensed population of approximately 122 million. As of December 31, 2008, our
networks in our Expansion Markets cover a population of approximately 41 million.
Customers. Net customer additions in our Expansion Markets were 1,076,076 for the year ended December 31,
2008, compared to 663,853 for the year ended December 31, 2007, an increase of 62%. Total customers were
2,379,957 as of December 31, 2008, an increase of approximately 83% over total customers as of December 31,
2007. The increase in total customers in the Expansion Markets is primarily attributable to the continued demand
for our service offerings as well as the continued expansion of our service coverage area existing Expansion Markets
and our recent launches of service in new markets. Net customer additions increased to 663,853 for the year ended
December 31, 2007 from 587,072 for the year ended December 31, 2006 due to the continued demand for our
service offerings and the launch of our services in new markets.
Adjusted EBITDA (Deficit). Adjusted EBITDA (Deficit) is presented in accordance with SFAS No. 131 as it is
the primary performance metric for which our reportable segments are evaluated and it is utilized by management to
facilitate evaluation of our ability to meet future debt service, capital expenditures and working capital requirements
and to fund future growth. For the year ended December 31, 2008, Expansion Markets Adjusted EBITDA was
$62.8 million compared to an Adjusted EBITDA of $12.9 million for the year ended December 31, 2007. The
increase in Adjusted EBITDA, when compared to the previous year, was attributable to cost benefits achieved due to
the increasing scale of our business, partially offset by construction and launch expenses associated primarily with
the launch of service in new markets and expenses related to the build out of the New York and Boston metropolitan
areas. Adjusted EBITDA deficit for the year ended December 31, 2006 was $97.2 million. The increase in Adjusted
EBITDA for the year ended December 31, 2007, when compared to the year ended December 31, 2006, was
attributable to the growth in service revenues in our existing Expansion Markets as well as the achievement of cost
benefits due to the increasing scale of our business in the Expansion Markets offset by significant expenses related
to the buildout and launch of service new markets.
Adjusted EBITDA as a Percent of Service Revenues. Adjusted EBITDA as a percent of service revenues is
calculated by dividing Adjusted EBITDA by total service revenues. Expansion Markets Adjusted EBITDA as
percent of service revenues for the year ended December 31, 2008 and 2007 was 6.7% and 2.6%, respectively.
Consistent with the increase in Expansion Markets Adjusted EBITDA, we continue to experience corresponding
increases in Expansion Markets Adjusted EBITDA as a percent of service revenues due to the growth in service
revenues as well as cost benefits due to the increasing scale of our business in the Expansion Markets, partially
offset by construction and launch expenses associated with new markets.
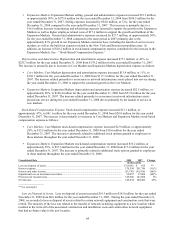
The following table shows a summary of certain quarterly key performance measures for the periods indicated for
our Expansion Markets.
Three Months Ended
March 31,
2007
June 30,
2007
September 30,
2007
December 31,
2007
March 31,
2008
June 30,
2008
September 30,
2008
December 31,
2008
(Dollars in thousands)
Expansion Markets Customers:
End of period ................................................... 910,392 1,007,626 1,086,199 1,303,881 1,618,603 1,782,696 2,001,582 2,379,957
Net additions.................................................... 270,364 97,234 78,573 217,682 314,722 164,093 218,886 378,375
Expansion Markets Adjusted EBITDA
(Deficit)........................................................... $ (1,005) $ 12,576 $ 13,516 $ (12,205) $ 7,288 $ 22,832 $ 18,699 $ 13,980
Expansion Markets Adjusted EBITDA as a
Percent of Service Revenues .......................... n/m 10.2% 10.3% n/m 3.8% 10.3% 7.8% 5.0%