Metro PCS 2008 Annual Report Download - page 70
Download and view the complete annual report
Please find page 70 of the 2008 Metro PCS annual report below. You can navigate through the pages in the report by either clicking on the pages listed below, or by using the keyword search tool below to find specific information within the annual report.-
 1
1 -
2
-
3
-
4
-
5
-
6
-
7
-
8
-
9
-
10
-
11
-
12
-
13
-
14
-
15
-
16
-
17
-
18
-
19
-
20
-
21
-
22
-
23
-
24
-
25
-
26
-
27
-
28
-
29
-
30
-
31
-
32
-
33
-
34
-
35
-
36
-
37
-
38
-
39
-
40
-
41
-
42
-
43
-
44
-
45
-
46
-
47
-
48
-
49
-
50
-
51
-
52
-
53
-
54
-
55
-
56
-
57
-
58
-
59
-
 60
60 -
 61
61 -
 62
62 -
 63
63 -
 64
64 -
 65
65 -
 66
66 -
 67
67 -
 68
68 -
 69
69 -
 70
70 -
 71
71 -
 72
72 -
 73
73 -
 74
74 -
 75
75 -
 76
76 -
 77
77 -
 78
78 -
 79
79 -
 80
80 -
81
-
82
-
83
-
84
-
85
-
86
-
87
-
88
-
89
-
90
-
91
-
92
-
93
-
94
-
95
-
96
-
97
-
98
-
99
-
100
-
101
-
102
-
103
-
104
-
105
-
106
-
107
-
108
-
109
-
110
-
111
-
112
-
113
-
114
-
115
-
116
-
117
-
118
-
119
-
120
-
121
-
122
-
123
-
124
-
125
-
126
-
127
-
128
-
129
-
130
-
131
-
132
-
133
-
134
-
135
-
136
-
137
-
138
-
139
-
140
-
141
-
142
-
143
-
144
-
145
-
146
-
147
-
148
-
149
-
150
-
151
-
152
 |
 |

61
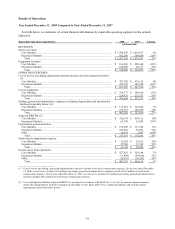
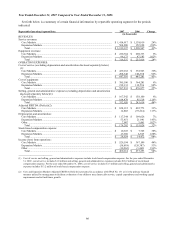
Results of Operations
Year Ended December 31, 2008 Compared to Year Ended December 31, 2007
Set forth below is a summary of certain financial information by reportable operating segment for the periods
indicated:
Reportable Operating Segment Data 2008 2007 Change
(in thousands)
REVENUES:
Service revenues:
Core Markets ................................................................................................................ $ 1,504,870 $ 1,414,917 6%
Expansion Markets ....................................................................................................... 932,380 504,280 85%
Total ......................................................................................................................... $ 2,437,250 $ 1,919,197 27%
Equipment revenues:
Core Markets ................................................................................................................ $ 186,263 $ 220,364 (15)%
Expansion Markets ....................................................................................................... 128,003 96,173 33%
Total ......................................................................................................................... $ 314,266 $ 316,537 (1)%
OPERATING EXPENSES:
Cost of service (excluding depreciation and amortization disclosed separately below)
(1):
Core Markets ................................................................................................................ $ 437,765 $ 439,162 0%
Expansion Markets ....................................................................................................... 419,530 208,348 101%
Total ......................................................................................................................... $ 857,295 $ 647,510 32%
Cost of equipment:
Core Markets ................................................................................................................ $ 374,777 $ 385,100 (3)%
Expansion Markets ....................................................................................................... 329,871 212,133 56%
Total ......................................................................................................................... $ 704,648 $ 597,233 18%
Selling, general and administrative expenses (excluding depreciation and amortization
disclosed separately below) (1):
Core Markets ................................................................................................................ $ 171,819 $ 167,542 3%
Expansion Markets ....................................................................................................... 275,763 184,478 50%
Total ......................................................................................................................... $ 447,582 $ 352,020 27%
Adjusted EBITDA (2):
Core Markets ................................................................................................................ $ 720,334 $ 654,112 10%
Expansion Markets ....................................................................................................... 62,799 12,883 387%
Depreciation and amortization:
Core Markets ................................................................................................................ $ 130,695 $ 117,344 11%
Expansion Markets ....................................................................................................... 106,410 53,851 98%
Other............................................................................................................................. 18,214 7,007 160%
Total ......................................................................................................................... $ 255,319 $ 178,202 43%
Stock-based compensation expense:
Core Markets ................................................................................................................ $ 13,562 $ 10,635 28%
Expansion Markets ....................................................................................................... 27,580 17,389 59%
Total ......................................................................................................................... $ 41,142 $ 28,024 47%
Income (loss) from operations:
Core Markets ................................................................................................................ $ 557,425 $ 529,194 5%
Expansion Markets ....................................................................................................... (71,440) (58,818) 21%
Other............................................................................................................................. (18,218) (10,262) 78%
Total ......................................................................................................................... $ 467,767 $ 460,114 2%
________________________
(1) Cost of service and selling, general and administrative expenses include stock-based compensation expense. For the year ended December
31, 2008, cost of service includes $2.9 million and selling, general and administrative expenses includes $38.2 million of stock-based
compensation expense. For the year ended December 31, 2007, cost of service includes $1.8 million and selling, general and administrative
expenses includes $26.2 million of stock-based compensation expense.
(2) Core and Expansion Markets Adjusted EBITDA is presented in accordance with SFAS No. 131 as it is the primary financial measure
utilized by management to facilitate evaluation of our ability to meet future debt service, capital expenditures and working capital
requirements and to fund future growth.