Metro PCS 2008 Annual Report Download - page 79
Download and view the complete annual report
Please find page 79 of the 2008 Metro PCS annual report below. You can navigate through the pages in the report by either clicking on the pages listed below, or by using the keyword search tool below to find specific information within the annual report.-
 1
1 -
2
-
3
-
4
-
5
-
6
-
7
-
8
-
9
-
10
-
11
-
12
-
13
-
14
-
15
-
16
-
17
-
18
-
19
-
20
-
21
-
22
-
23
-
24
-
25
-
26
-
27
-
28
-
29
-
30
-
31
-
32
-
33
-
34
-
35
-
36
-
37
-
38
-
39
-
40
-
41
-
42
-
43
-
44
-
45
-
46
-
47
-
48
-
49
-
50
-
51
-
52
-
53
-
54
-
55
-
56
-
57
-
58
-
59
-
60
-
61
-
62
-
63
-
64
-
65
-
66
-
67
-
68
-
 69
69 -
 70
70 -
 71
71 -
 72
72 -
 73
73 -
 74
74 -
 75
75 -
 76
76 -
 77
77 -
 78
78 -
 79
79 -
 80
80 -
 81
81 -
 82
82 -
 83
83 -
 84
84 -
 85
85 -
 86
86 -
 87
87 -
 88
88 -
 89
89 -
90
-
91
-
92
-
93
-
94
-
95
-
96
-
97
-
98
-
99
-
100
-
101
-
102
-
103
-
104
-
105
-
106
-
107
-
108
-
109
-
110
-
111
-
112
-
113
-
114
-
115
-
116
-
117
-
118
-
119
-
120
-
121
-
122
-
123
-
124
-
125
-
126
-
127
-
128
-
129
-
130
-
131
-
132
-
133
-
134
-
135
-
136
-
137
-
138
-
139
-
140
-
141
-
142
-
143
-
144
-
145
-
146
-
147
-
148
-
149
-
150
-
151
-
152
 |
 |

70
These investments are subject to credit, liquidity, market and interest rate risk. We made investments of $133.9
million in certain “AAA” rated auction rate securities some of which are secured by collateralized debt obligations
with a portion of the underlying collateral being mortgage securities or related to mortgage securities. With the
liquidity issues experienced in global credit and capital markets, the auction rate securities held by us at December
31, 2007 have experienced multiple failed auctions as the amount of securities submitted for sale in the auctions has
exceeded the amount of purchase orders. As a result, we recognized an other-than-temporary impairment loss on
investment securities in the amount of $97.8 million during the year ended December 31, 2007.
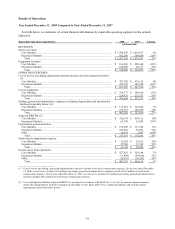
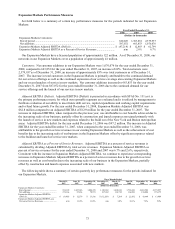
Provision for Income Taxes. Income tax expense for the year ended December 31, 2007 increased to $123.1
million, which is approximately 55% of our income before provision for income taxes. The provision for income
taxes for the year ended December 31, 2007 includes a tax valuation allowance on the impairment loss on
investment securities equal to 15% of our income before provision in income taxes. For the year ended December
31, 2006 the provision for income taxes was $36.7 million, or approximately 41% of income before provision for
income taxes.
Net Income. Net income increased $46.6 million, or 87%, to $100.4 million for the year ended December 31,
2007 compared to $53.8 million for the year ended December 31, 2006. The increase is primarily attributable to a
35% growth in customers during the year ended December 31, 2007 as well as cost benefits achieved due to the
increasing scale of our business in the Core and Expansion Markets. In addition, the increase in net income is due to
a 197% increase in interest income as a result of the significant increase in our cash balances due to proceeds from
our initial public offering and additional funding under our 9¼% senior notes. However, these benefits were
partially offset by an increase in interest expense due to an increase in the Company’s average debt outstanding for
the year ended December 31, 2007 compared to the same period in 2006 as well as the $97.8 million impairment
loss on investment securities.
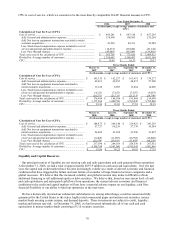
Performance Measures
In managing our business and assessing our financial performance, we supplement the information provided by
financial statement measures with several customer-focused performance metrics that are widely used in the
wireless industry. These metrics include average revenue per user per month, or ARPU, which measures service
revenue per customer; cost per gross customer addition, or CPGA, which measures the average cost of acquiring a
new customer; cost per user per month, or CPU, which measures the non-selling cash cost of operating our business
on a per customer basis; and churn, which measures turnover in our customer base. Effective December 31, 2008,
we revised our definition of ARPU to include activation revenues. Activation revenues are related to the reactivation
of accounts that have previously disconnected and we believe that these revenues are more appropriately presented
as a component of ARPU rather than a reduction to CPGA. Prior year measures have been restated to reflect this
revision. For a reconciliation of Non-GAAP performance measures and a further discussion of the measures, please
read “— Reconciliation of Non-GAAP Financial Measures” below.
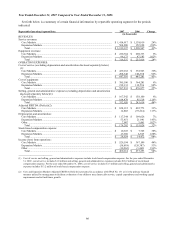
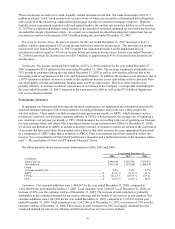
The following table shows annual metric information for 2006, 2007 and 2008.
Year Ended December 31,
2006 2007 2008
Customers:
End of period ............................................................................................
.
2,940,986 3,962,786 5,366,833
Net additions.............................................................................................
.
1,016,365 1,021,800 1,404,047
Churn:
Average monthly rate................................................................................
.
4.6% 4.7% 4.7%
ARPU ........................................................................................................
.
$ 43.26 $ 43.31 $ 41.39
CPGA ........................................................................................................
.
$ 121.12 $ 127.97 $ 127.21
CPU ...........................................................................................................
.
$ 19.65 $ 18.33 $ 18.17
Customers. Net customer additions were 1,404,047 for the year ended December 31, 2008, compared to
1,021,800 for the year ended December 31, 2007. Total customers were 5,366,833 as of December 31, 2008, an
increase of 35% over the customer total as of December 31, 2007. The increase in total customers is primarily
attributable to the continued demand for our service offerings and the launch of our services in new markets. Net
customer additions were 1,021,800 for the year ended December 31, 2007, compared to 1,016,365 for the year
ended December 31, 2006. Total customers were 3,962,786 as of December 31, 2007, an increase of 35% over the
customer total as of December 31, 2006. The increase in total customers in 2007 was largely attributable to the
continued demand for our service offerings and the launch of our services in new markets.