Metro PCS 2008 Annual Report Download - page 83
Download and view the complete annual report
Please find page 83 of the 2008 Metro PCS annual report below. You can navigate through the pages in the report by either clicking on the pages listed below, or by using the keyword search tool below to find specific information within the annual report.-
 1
1 -
2
-
3
-
4
-
5
-
6
-
7
-
8
-
9
-
10
-
11
-
12
-
13
-
14
-
15
-
16
-
17
-
18
-
19
-
20
-
21
-
22
-
23
-
24
-
25
-
26
-
27
-
28
-
29
-
30
-
31
-
32
-
33
-
34
-
35
-
36
-
37
-
38
-
39
-
40
-
41
-
42
-
43
-
44
-
45
-
46
-
47
-
48
-
49
-
50
-
51
-
52
-
53
-
54
-
55
-
56
-
57
-
58
-
59
-
60
-
61
-
62
-
63
-
64
-
65
-
66
-
67
-
68
-
69
-
70
-
71
-
72
-
 73
73 -
 74
74 -
 75
75 -
 76
76 -
 77
77 -
 78
78 -
 79
79 -
 80
80 -
 81
81 -
 82
82 -
 83
83 -
 84
84 -
 85
85 -
 86
86 -
 87
87 -
 88
88 -
 89
89 -
 90
90 -
 91
91 -
 92
92 -
 93
93 -
94
-
95
-
96
-
97
-
98
-
99
-
100
-
101
-
102
-
103
-
104
-
105
-
106
-
107
-
108
-
109
-
110
-
111
-
112
-
113
-
114
-
115
-
116
-
117
-
118
-
119
-
120
-
121
-
122
-
123
-
124
-
125
-
126
-
127
-
128
-
129
-
130
-
131
-
132
-
133
-
134
-
135
-
136
-
137
-
138
-
139
-
140
-
141
-
142
-
143
-
144
-
145
-
146
-
147
-
148
-
149
-
150
-
151
-
152
 |
 |

74
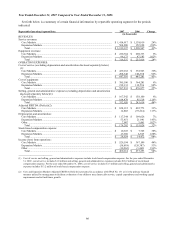
Reconciliation of Non-GAAP Financial Measures
We utilize certain financial measures and key performance indicators that are not calculated in accordance with
GAAP to assess our financial and operating performance. A non-GAAP financial measure is defined as a numerical
measure of a company’s financial performance that (i) excludes amounts, or is subject to adjustments that have the
effect of excluding amounts, that are included in the comparable measure calculated and presented in accordance
with GAAP in the statement of income or statement of cash flows; or (ii) includes amounts, or is subject to
adjustments that have the effect of including amounts, that are excluded from the comparable measure so calculated
and presented.
ARPU, CPGA, and CPU are non-GAAP financial measures utilized by our management to judge our ability to
meet our liquidity requirements and to evaluate our operating performance. We believe these measures are important
in understanding the performance of our operations from period to period, and although every company in the
wireless industry does not define each of these measures in precisely the same way, we believe that these measures
(which are common in the wireless industry) facilitate key liquidity and operating performance comparisons with
other companies in the wireless industry. The following tables reconcile our non-GAAP financial measures with our
financial statements presented in accordance with GAAP.
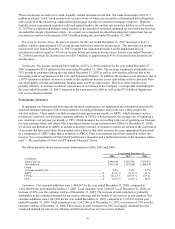
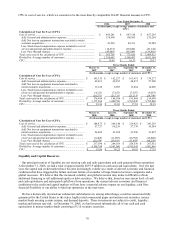
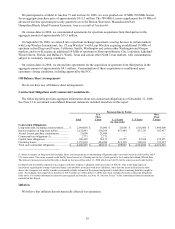
ARPU — We utilize ARPU to evaluate our per-customer service revenue realization and to assist in forecasting
our future service revenues. ARPU is calculated exclusive of pass through charges that we collect from our
customers and remit to the appropriate government agencies.
Average number of customers for any measurement period is determined by dividing (a) the sum of the average
monthly number of customers for the measurement period by (b) the number of months in such period. Average
monthly number of customers for any month represents the sum of the number of customers on the first day of the
month and the last day of the month divided by two. The following table shows the calculation of ARPU for the
periods indicated.
Year Ended December 31,
2006 2007 2008
(In thousands, except average number of customers and
ARPU)
Calculation of Average Revenue Per User
(ARPU):
Service revenues................................................................................... $ 1,290,947 $ 1,919,197 $ 2,437,250
Less:
Pass through charges.......................................................................... (45,640) (95,946) (136,801)
Net service revenues ............................................................................. $ 1,245,307 $ 1,823,251 $ 2,300,449
Divided by:
Average number of customers ............................................................. 2,398,682 3,508,497 4,631,168
ARPU ................................................................................................... $ 43.26 $ 43.31 $ 41.39
Three Months Ended
March 31,
2007
June 30,
2007
September 30,
2007
December 31,
2007
(In thousands, except average number of customers and ARPU)
Calculation of Average Revenue Per User (ARPU):
Service revenues....................................................................... $ 439,516 $ 479,341 $ 489,131 $ 511,209
Less:
Pass through charges.............................................................. (20,271) (25,721) (25,215) (24,740)
Net service revenues ................................................................. $ 419,245 $ 453,620 $ 463,916 $ 486,469
Divided by: Average number of customers .............................. 3,175,284 3,480,780 3,592,045 3,785,880
ARPU ....................................................................................... $ 44.01 $ 43.44 $ 43.05 $ 42.83
Three Months Ended
March 31,
2008
June 30,
2008
September 30,
2008
December 31,
2008
(In thousands, except average number of customers and ARPU)
Calculation of Average Revenue Per User (ARPU):
Service revenues....................................................................... $ 561,970 $ 598,562 $ 610,691 $ 666,028
Less:
Pass through charges.............................................................. (26,554) (30,583) (31,445) (48,220)
Net service revenues ................................................................. $ 535,416 $ 567,979 $ 579,246 $ 617,808
Divided by: Average number of customers .............................. 4,198,794 4,501,980 4,741,043 5,082,856
ARPU ....................................................................................... $ 42.51 $ 42.05 $ 40.73 $ 40.52