Metro PCS 2008 Annual Report Download - page 130
Download and view the complete annual report
Please find page 130 of the 2008 Metro PCS annual report below. You can navigate through the pages in the report by either clicking on the pages listed below, or by using the keyword search tool below to find specific information within the annual report.-
 1
1 -
2
-
3
-
4
-
5
-
6
-
7
-
8
-
9
-
10
-
11
-
12
-
13
-
14
-
15
-
16
-
17
-
18
-
19
-
20
-
21
-
22
-
23
-
24
-
25
-
26
-
27
-
28
-
29
-
30
-
31
-
32
-
33
-
34
-
35
-
36
-
37
-
38
-
39
-
40
-
41
-
42
-
43
-
44
-
45
-
46
-
47
-
48
-
49
-
50
-
51
-
52
-
53
-
54
-
55
-
56
-
57
-
58
-
59
-
60
-
61
-
62
-
63
-
64
-
65
-
66
-
67
-
68
-
69
-
70
-
71
-
72
-
73
-
74
-
75
-
76
-
77
-
78
-
79
-
80
-
81
-
82
-
83
-
84
-
85
-
86
-
87
-
88
-
89
-
90
-
91
-
92
-
93
-
94
-
95
-
96
-
97
-
98
-
99
-
100
-
101
-
102
-
103
-
104
-
105
-
106
-
107
-
108
-
109
-
110
-
111
-
112
-
113
-
114
-
115
-
116
-
117
-
118
-
119
-
 120
120 -
 121
121 -
 122
122 -
 123
123 -
 124
124 -
 125
125 -
 126
126 -
 127
127 -
 128
128 -
 129
129 -
 130
130 -
 131
131 -
 132
132 -
 133
133 -
 134
134 -
 135
135 -
 136
136 -
 137
137 -
 138
138 -
 139
139 -
 140
140 -
141
-
142
-
143
-
144
-
145
-
146
-
147
-
148
-
149
-
150
-
151
-
152
 |
 |

MetroPCS Communications, Inc. and Subsidiaries
Notes to Consolidated Financial Statements
December 31, 2008, 2007 and 2006
F-28
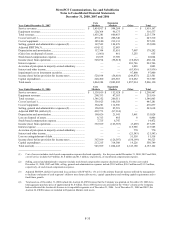
The following table summarizes information about stock options outstanding at December 31, 2008:
Options Outstanding Options Vested
Exercise Price
Number of
Shares
Weighted
Average
Contractual
Life
Weighted
Average
Exercise
Price
Number of
Shares
Weighted
Average
Exercise
Price
$0.08 - $5.49.................................................................. 3,969,690 3.84 $ 2.52 3,969,690 $ 2.52
$6.31 - $7.15.................................................................. 5,792,376 6.77 $ 7.14 4,799,713 $ 7.14
$7.54 - $8.67.................................................................. 637,525 7.51 $ 8.08 330,866 $ 8.08
$11.33 - $11.33.............................................................. 6,909,625 7.97 $ 11.33 3,858,177 $ 11.33
$12.77 - $15.29.............................................................. 858,450 9.39 $ 14.70 118,419 $ 15.08
$16.20 - $16.20.............................................................. 5,254,185 9.18 $ 16.20 42,575 $ 16.20
$16.40 - $21.10.............................................................. 901,500 9.34 $ 18.33 45,300 $ 17.09
$23.00 - $36.58.............................................................. 6,354,237 8.24 $ 24.60 2,671,868 $ 24.43
In 2004, Congress passed the American Job Creation Act of 2004 which changed certain rules with respect to
deferred compensation, including options to purchase MetroPCS’ common stock which were granted below the fair
market value of the common stock as of the grant date. MetroPCS had previously granted certain options to
purchase its common stock under the 1995 Plan at exercise prices which MetroPCS believes were below the fair
market value of its common stock at the time of grant. In December 2005, MetroPCS offered to amend the stock
option grants of all affected employees by increasing the exercise price of such affected stock option grants to the
fair value of MetroPCS’ common stock as of the date of grant and granting additional stock options, which vested
50% on January 1, 2006 and 50% on January 1, 2007, at the fair market value of MetroPCS’ common stock as of the
grant date provided that the employee remained employed by the Company on those dates. The total number of
affected stock options was 2,617,140 and MetroPCS granted 407,274 additional stock options.
During the year ended December 31, 2008, 2,810,245 options granted under the Option Plans were exercised for
2,810,245 shares of common stock. The intrinsic value of these options was approximately $38.6 million and total
proceeds were approximately $12.6 million for the year ended December 31, 2008. During the year ended
December 31, 2007, 2,562,056 options granted under the Option Plans were exercised for 2,562,056 shares of
common stock. The intrinsic value of these options was approximately $47.7 million and total proceeds were
approximately $9.7 million for the year ended December 31, 2007. During the year ended December 31, 2006,
1,148,328 options granted under the Option Plans were exercised for 1,148,328 shares of common stock. The
intrinsic value of these options was approximately $9.0 million and total proceeds were approximately $2.7 million
for the year ended December 31, 2006.
The following table summarizes information about unvested stock option grants:
Stock Option Grants Shares
Weighted
Average
Grant-Date
Fair Value
Unvested balance, January 1, 2008....................................................................................... 15,738,809 $ 6.99
Grants ................................................................................................................................... 6,566,165 $ 6.95
Vested shares........................................................................................................................ (6,824,591) $ 6.59
Forfeitures ............................................................................................................................ (639,403) $ 8.12
Unvested balance, December 31, 2008................................................................................. 14,840,980 $ 7.11
The Company determines fair value of stock option grants as the closing share price of the Company’s common
stock at grant-date. The weighted average grant-date fair value of the stock option grants for the year ended
December 31, 2008, 2007 and 2006 is $6.95, $9.89 and $3.98, respectively. The total fair value of stock options that
vested during the year ended December 31, 2008 was $45.0 million.
The Company has recognized $41.1 million, $28.0 million and $14.5 million of non-cash stock-based
compensation expense in the years ended December 31, 2008, 2007 and 2006, respectively, and an income tax
benefit of $17.2 million, $11.0 million and $5.8 million, respectively.