Metro PCS 2008 Annual Report Download - page 71
Download and view the complete annual report
Please find page 71 of the 2008 Metro PCS annual report below. You can navigate through the pages in the report by either clicking on the pages listed below, or by using the keyword search tool below to find specific information within the annual report.-
 1
1 -
2
-
3
-
4
-
5
-
6
-
7
-
8
-
9
-
10
-
11
-
12
-
13
-
14
-
15
-
16
-
17
-
18
-
19
-
20
-
21
-
22
-
23
-
24
-
25
-
26
-
27
-
28
-
29
-
30
-
31
-
32
-
33
-
34
-
35
-
36
-
37
-
38
-
39
-
40
-
41
-
42
-
43
-
44
-
45
-
46
-
47
-
48
-
49
-
50
-
51
-
52
-
53
-
54
-
55
-
56
-
57
-
58
-
59
-
60
-
 61
61 -
 62
62 -
 63
63 -
 64
64 -
 65
65 -
 66
66 -
 67
67 -
 68
68 -
 69
69 -
 70
70 -
 71
71 -
 72
72 -
 73
73 -
 74
74 -
 75
75 -
 76
76 -
 77
77 -
 78
78 -
 79
79 -
 80
80 -
 81
81 -
82
-
83
-
84
-
85
-
86
-
87
-
88
-
89
-
90
-
91
-
92
-
93
-
94
-
95
-
96
-
97
-
98
-
99
-
100
-
101
-
102
-
103
-
104
-
105
-
106
-
107
-
108
-
109
-
110
-
111
-
112
-
113
-
114
-
115
-
116
-
117
-
118
-
119
-
120
-
121
-
122
-
123
-
124
-
125
-
126
-
127
-
128
-
129
-
130
-
131
-
132
-
133
-
134
-
135
-
136
-
137
-
138
-
139
-
140
-
141
-
142
-
143
-
144
-
145
-
146
-
147
-
148
-
149
-
150
-
151
-
152
 |
 |
62
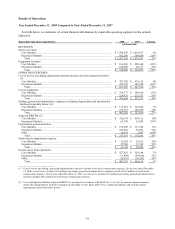
Service Revenues. Service revenues increased $518.1 million, or approximately 27%, to $2.4 billion for the year
ended December 31, 2008 from $1.9 billion for the year ended December 31, 2007. The increase is due to increases
in Core Markets and Expansion Markets service revenues as follows:
•Core Markets. Core Markets service revenues increased $90.0 million, or 6%, to $1.5 billion for the year
ended December 31, 2008 from $1.4 billion for the year ended December 31, 2007. The increase in service
revenues is primarily attributable to net customer additions of approximately 328,000 customers for the year
ended December 31, 2008, which accounted for approximately $157.3 million of the Core Markets increase.
This increase was partially offset by the higher participation in our Family Plans as well as reduced revenue
from certain features included in our service plans that were previously provided a la carte, accounting for an
approximately $56.2 million decrease. In addition, consolidated pass through charges revenue increased
$40.9 million during the year ended December 31, 2008 compared to the same period in 2007. This increase
is primarily attributable to a 35% increase in our consolidated customer base since December 31, 2007 and
higher federal universal service fund, or FUSF, rates. Beginning on January 1, 2008, a portion of these
revenues were allocated to the Expansion Markets in the amount of $52.2 million resulting in a net decrease
of $11.3 million in the Core Markets for the year ended December 31, 2008 compared to the same period in
2007.
•Expansion Markets. Expansion Markets service revenues increased $428.1 million, or approximately 85%, to
$932.4 million for the year ended December 31, 2008 from $504.3 million for the year ended December 31,
2007. The increase in service revenues is primarily attributable to net customer additions of approximately
1.1 million customers for the year ended December 31, 2008, which accounted for approximately $417.4
million of the Expansion Markets increase. This increase was partially offset by the higher participation in
our Family Plans as well as reduced revenue from certain features included in our service plans that were
previously provided a la carte, accounting for an approximately $46.3 million decrease. In addition, pass
through charges revenue increased $52.2 million during the year ended December 31, 2008 compared to the
same period in 2007 due to the allocation of a portion of these revenues to the Expansion Markets beginning
on January 1, 2008.
Equipment Revenues. Equipment revenues decreased $2.3 million, or approximately 1%, to $314.3 million for the
year ended December 31, 2008 from $316.6 million for the year ended December 31, 2007. The decrease is due
primarily to a decrease in Core Markets equipment revenues, partially offset by an increase in Expansion Markets
equipment revenues as follows:
•Core Markets. Core Markets equipment revenues decreased $34.1 million, or 15%, to $186.3 million for the
year ended December 31, 2008 from $220.4 million for the year ended December 31, 2007. The decrease in
equipment revenues is primarily attributable to a lower average price of handsets activated reducing
equipment revenues by $36.4 million, partially offset by an increase in upgrade handset sales to existing
customers accounting for a $1.7 million increase in equipment revenues.
•Expansion Markets. Expansion Markets equipment revenues increased $31.8 million, or 33%, to $128.0
million for the year ended December 31, 2008 from $96.2 million for the year ended December 31, 2007.
The increase in equipment revenues is primarily attributable to an increase in gross customer additions which
accounted for $31.1 million of the Expansion Markets increase, coupled with an increase in upgrade handset
sales to existing customers accounting for a $26.0 million increase. These increases in equipment revenues
were partially offset by a lower average price of handsets activated which accounted for a $28.2 million
decrease.
Cost of Service. Cost of service increased $209.8 million, or approximately 32%, to $857.3 million for the year
ended December 31, 2008 from $647.5 million for the year ended December 31, 2007. The increase is due primarily
to an increase in Expansion Markets cost of service, partially offset by a decrease in Core Markets cost of service as
follows:
•Core Markets. Core Markets cost of service decreased $1.4 million to $437.8 million for the year ended
December 31, 2008 from $439.2 million for the year ended December 31, 2007. Core Markets cost of service
(excluding pass through charges) increased $13.6 million, or 4%, to $353.0 million for the year ended
December 31, 2008 from $339.4 million for the year ended December 31, 2007. The increase was primarily
attributable to the 12% growth in our Core Markets customer base and the deployment of additional network
infrastructure during the twelve months ended December 31, 2008. In addition, consolidated pass through