LensCrafters 2013 Annual Report Download - page 6
Download and view the complete annual report
Please find page 6 of the 2013 LensCrafters annual report below. You can navigate through the pages in the report by either clicking on the pages listed below, or by using the keyword search tool below to find specific information within the annual report.-
 1
1 -
 2
2 -
 3
3 -
 4
4 -
 5
5 -
 6
6 -
 7
7 -
 8
8 -
 9
9 -
 10
10 -
 11
11 -
 12
12 -
 13
13 -
 14
14 -
 15
15 -
 16
16 -
 17
17 -
18
-
19
-
20
-
21
-
22
-
23
-
24
-
25
-
26
-
27
-
28
-
29
-
30
-
31
-
32
-
33
-
34
-
35
-
36
-
37
-
38
-
39
-
40
-
41
-
42
-
43
-
44
-
45
-
46
-
47
-
48
-
49
-
50
-
51
-
52
-
53
-
54
-
55
-
56
-
57
-
58
-
59
-
60
-
61
-
62
-
63
-
64
-
65
-
66
-
67
-
68
-
69
-
70
-
71
-
72
-
73
-
74
-
75
-
76
-
77
-
78
-
79
-
80
-
81
-
82
-
83
-
84
-
85
-
86
-
87
-
88
-
89
-
90
-
91
-
92
-
93
-
94
-
95
-
96
-
97
-
98
-
99
-
100
-
101
-
102
-
103
-
104
-
105
-
106
-
107
-
108
-
109
-
110
-
111
-
112
-
113
-
114
-
115
-
116
-
117
-
118
-
119
-
120
-
121
-
122
-
123
-
124
-
125
-
126
-
127
-
128
-
129
-
130
-
131
-
132
-
133
-
134
-
135
-
136
-
137
-
138
-
139
-
140
-
141
-
142
-
143
-
144
-
145
-
146
-
147
-
148
-
149
-
150
-
151
-
152
-
153
-
154
-
155
-
156
-
157
-
158
-
159
-
160
-
161
-
162
-
163
-
164
-
165
-
166
-
167
-
168
-
169
-
170
-
171
-
172
-
173
-
174
-
175
-
176
-
177
-
178
-
179
-
180
-
181
-
182
-
183
-
184
-
185
-
186
-
187
-
188
-
189
-
190
-
191
-
192
-
193
-
194
-
195
-
196
-
197
-
198
-
199
-
200
-
201
-
202
-
203
-
204
-
205
-
206
-
207
-
208
-
209
-
210
-
211
-
212
-
213
-
214
-
215
-
216
-
217
-
218
-
219
-
220
-
221
-
222
-
223
-
224
-
225
-
226
-
227
-
228
-
229
-
230
-
231
-
232
-
233
-
234
-
235
-
236
-
237
-
238
-
239
-
240
-
241
-
242
-
243
-
244
-
245
-
246
-
247
-
248
-
249
-
250
-
251
-
252
-
253
 |
 |

1
Luxottica Group S.p.A.
Headquarters and registered office ● Via C. Cantù 2, 20123 Milan, Italy
Capital Stock € 28,653,640.38
authorized and issued
MANAGEMENT REPORT AS OF DECEMBER 31, 2013
1. OPERATING PERFORMANCE FOR THE YEAR AND THE THREE MONTH PERIOD ENDED
DECEMBER 31, 2013
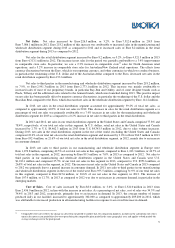
The Group’s growth continued throughout 2013. In a challenging economic environments the Group achieved
positive results in all the geographic markets in which it operates. Net sales increased from Euro 7,086.1 in 2012 to Euro
7,312.6 million in 2013(+3.2 percent at current exchange rates and +7.5 percent at constant exchange rates
1
). Net sales in the
fourth quarter of 2013 increase by +0.8 percent (+7.6 percent at constant exchange rates
1
) and were Euro 1,645.9 million
compared to Euro 1,632.3 million in the same period of 2012.
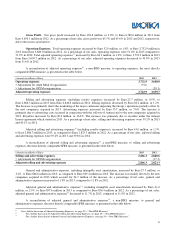
Earnings before Interest, Taxes, Depreciation and Amortization (“EBITDA”)
2
in 2013 rose by 7.1 percent to
Euro 1,422.3 million from Euro 1,328.4 in 2012. Additionally, adjusted EBITDA
2
increased by 6.0 percent to
Euro 1,431.3 million from Euro 1,350.1 million in 2012.
EBITDA
2
in the fourth quarter of 2013 rose by 0.4 percent to Euro 256.4 million from Euro 255.5 in the same
period of 2012.
Operating income for 2013 increased by 8.8 percent to Euro 1,055.7 million from Euro 970.1 million during the
same period of the previous year. The Group’s operating margin continued to grow rising from 13.7 percent in 2012 to
14.4 percent in 2013. Additionally, adjusted operating income
3
in 2013 increased by 7.3 percent to 1,064.7 million from
Euro 991.8 million in 2012. Adjusted operating margin
4
in 2013 increased to 14.6 percent from 14.0 percent in 2012.
Operating income for the fourth quarter of 2013 increased by 1.9 percent to Euro 164.1 million from
Euro 161.0 million during the same period of the previous year. The Group’s operating margin continued to grow rising from
9.9 percent in the fourth quarter of 2012 to 10.0 percent in the current period.
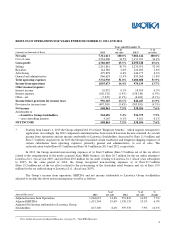
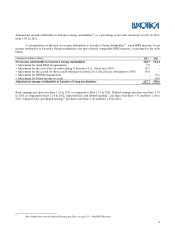
In 2013 net income attributable to Luxottica Stockholders increased by 1.9 percent to Euro 544.7 million from
Euro 534.4 million in the same period of 2012. Adjusted net income
5
attributable to Luxottica stockholders increased by
10.3 percent to Euro 617.3 million in 2013 from Euro 559.6 million in 2012. Earnings per share (“EPS”) was Euro 1.15 and
EPS expressed in USD was 1.53 (at an average rate of Euro/USD of 1.3277). Adjustied earnings per share
6
(“EPS”) was
Euro 1.31 and adjusted EPS expressed in USD was 1.74 (at an average rate of Euro/USD of 1.3277).
Net income attributable to Luxottica stockholders for the fourth quarter of 2013 decreased by 65.4 percent to Euro
25.9 million compared to Euro 74.9 million in the same period of 2012. Adjusted net income
5
attributable to Luxottica
stockholders for the fourth quarter of 2013 increased by 9.1 percent to Euro 92.6 million compared to Euro 84.9 million in
the same period of 2012.
By carefully controlling working capital, the Group generated positive free cash flow
7
in both the year
(Euro 610 million) and the fourth quarter (Euro 112 million of 2013). Net debt as of December 31, 2013 was
1
We calculate constant exchange rates by applying to the current period the average exchange rates between the Euro and the relevant currencies of the
various markets in which we operated during the three-month period and the year ended December 31, 2012. Please refer to Attachment 1 for further
details on exchange rates.
2
For a further discussion of EBITDA and adjusted EBITDA, see page 29—“Non-IFRS Measures.”
3
For a further discussion of adjusted operating income, see page 29—“Non-IFRS Measures.”
4
For a further discussion of adjusted operating margin, see page 29—“Non-IFRS Measures.”
5
For a further discussion of adjusted net income, see page 29—“Non-IFRS Measures.”
6
For a further discussion of adjusted earinings per share, see page 29—“Non-IFRS Measures.”
7
For a further discussion of free cash flow, see page 29—“Non-IFRS Measures.”